Does reverse osmosis remove microplastics?
For most owners, a reverse osmosis filter sits under the kitchen sink or on the counter. Lab tests show it does remove microplastics. In a French lab, RO filter membranes stopped every single plastic test particle, about 10 million at a time. But most people don't live in a lab, they live at home. In a study in Iraq, a one-month-old home filter with an RO stage only took out 82% of the microplastics. A two-year-old unit of the same type only took out 30%. And the worst part: water can pick plastic back up after it's been filtered. At German bottling plants, before the water was bottled, it had less than 1 plastic particle per liter. But after it was bottled in glass bottles, it had more than 317 times as much plastic. Plus, your at-home filter can't come with you. With scientists finding links between microplastics and heart attacks, strokes, blood clots, memory loss and dementia, here's what every reverse osmosis owner should know.
16 minute read · Updated · By Aelo Research

Short Summary
Yes, at the filter. Reverse osmosis, or RO, pushes water through a plastic sheet called a membrane. In a French lab, used membranes stopped every plastic test particle.[1]
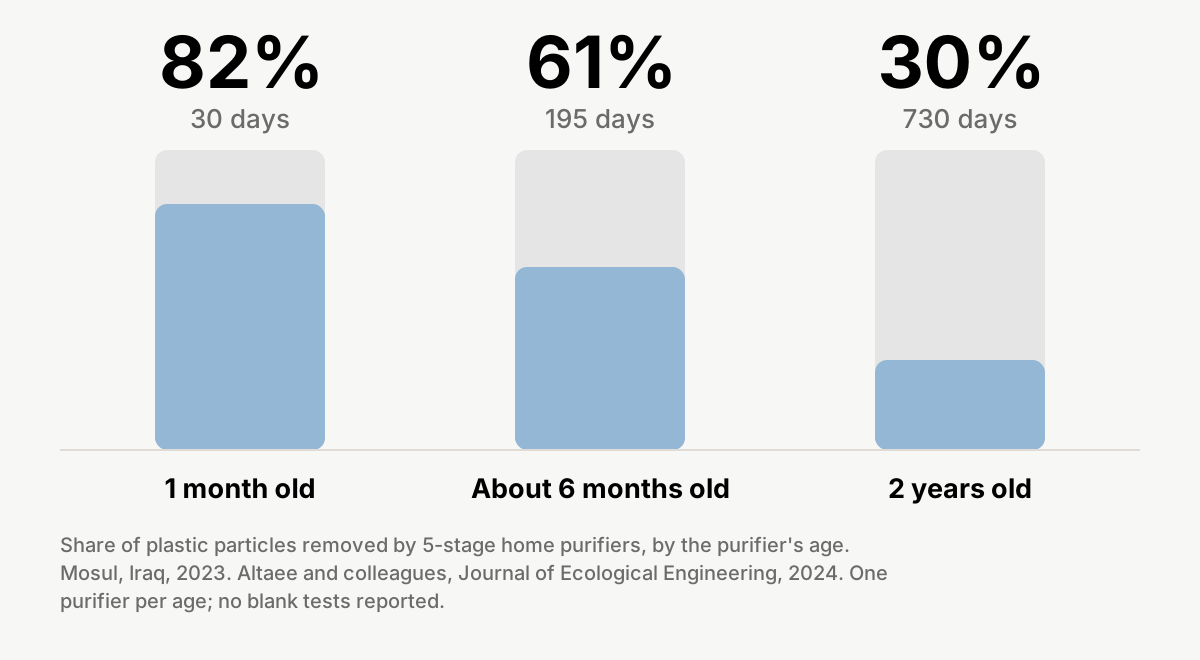
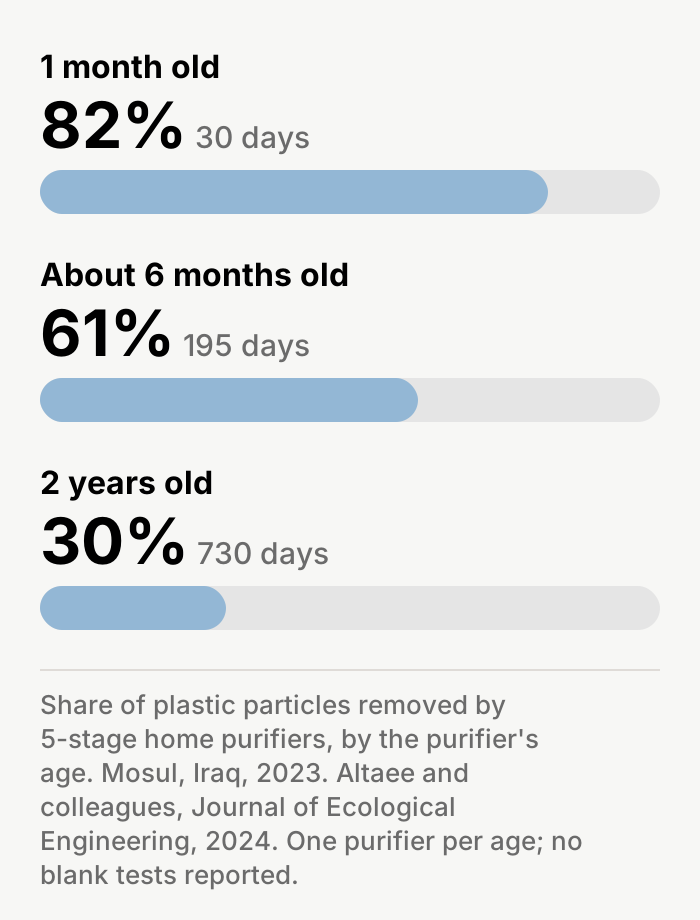
But a home isn't a lab. In a small study in Iraq, a one-month-old unit took out 82% of the plastic. Its two-year-old twin took out 30%.[2]
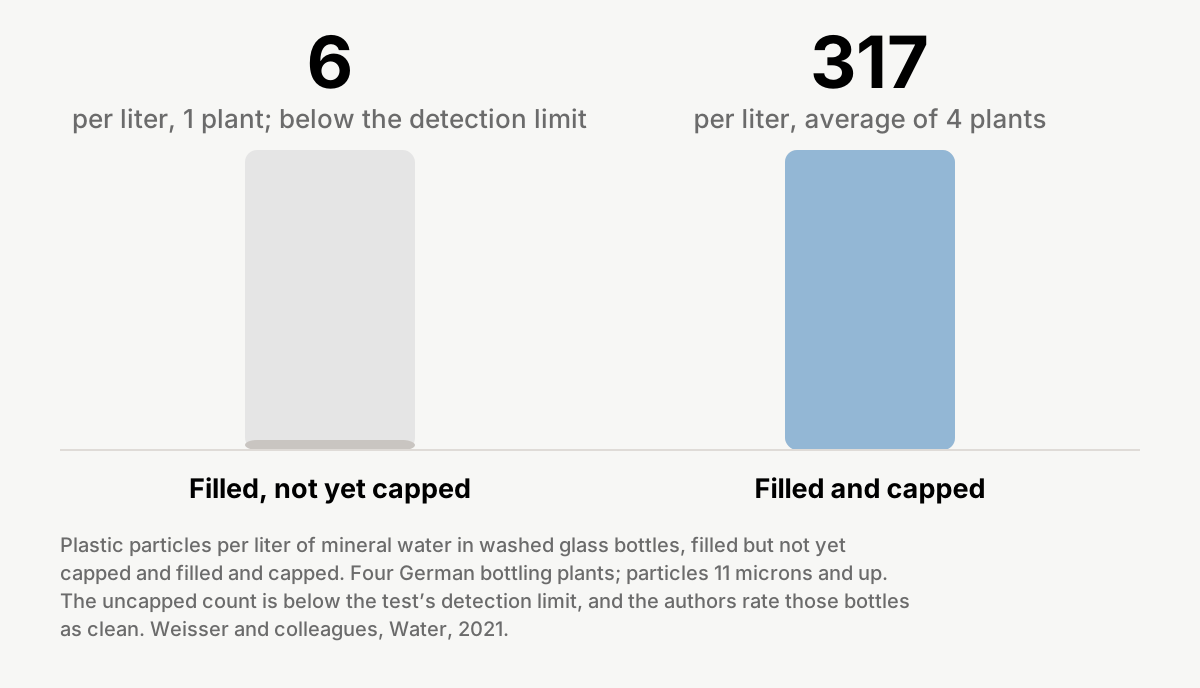
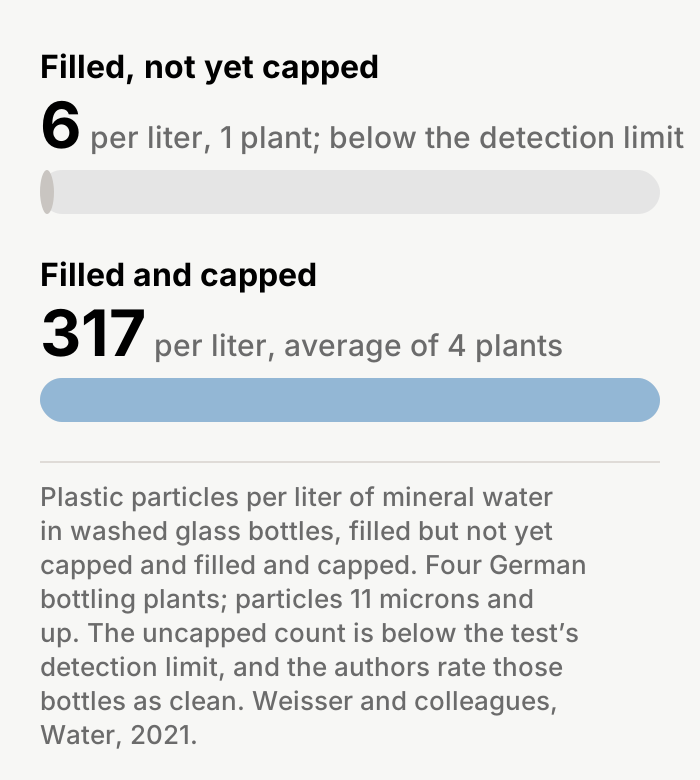
And clean water can pick plastic back up. At German bottling plants, water held under 1 plastic particle per liter before bottling. In capped glass bottles, it held 317, more than 300 times as much. Most of that plastic matched the cap's seal.[6]
And your RO can't follow you. By our count, people who drink water away from home drink 70% of that day's water there.[18]
Below, we walk through each study: what the scientists did, what they found and why it matters to you.
You already filter your water. Smart move.
If you have reverse osmosis at home, you're ahead of the curve. Maybe you carry a steel tumbler too. Maybe you swapped plastic straws for steel ones. You took your water into your own hands. Keep doing it.
You're in good company. The EPA estimates that about 1 million home RO units are sold in the US each year.[38]
A quick word about us. Aelo makes a filter straw, so we have a point of view. But this page is about the research. We'll show you what the studies found, good news first. Then you can judge for yourself.
What does reverse osmosis do?
It handles a wide range of problems
Minnesota's health department compared home units that remove arsenic. Its chart says RO "reduces or removes the widest array of contaminants" of the units it compares.[33]
Lead, salt and germs
The CDC says RO removes lead, copper and salt. It can also cut arsenic, fluoride and nitrate. And the CDC lists it as a filter that removes germs.[31, 32]
Forever chemicals (PFAS)
The EPA says RO has been "extremely effective" at removing PFAS.[34]
Better-tasting water
It improves taste and smell, too, the EPA says. It's one of the strongest water cleaners you can fit under a sink.[35]
How does reverse osmosis work?
Your water pressure does the work
Your home's water pressure pushes tap water through a few stages. First, filters catch sand, grit and chlorine. Chlorine would ruin the membrane.[37, 39]
The membrane does the heavy lifting
Next comes the membrane, a very thin plastic sheet. The CDC puts its holes at about 0.0001 micron. A micron is a thousandth of a millimeter. The smallest microplastics are 1 micron across, by the definition NSF uses for US filter standards. So by the CDC's figure, the holes are about 10,000 times smaller. Water squeezes through. Most of what's dissolved in it goes down the drain.[31, 37, 46]
Clean water waits in a tank
Clean water trickles out slowly, so it waits in a small tank. One more carbon filter polishes it on the way to its own faucet.[37]
At a glance: the French membrane test
- Tested
- pieces of used reverse osmosis membranes, one of them creased.[1]
- Challenge
- about 10 million plastic particles per piece.[1]
- Result
- no test particle in the clean water. Three larger flecks were judged to come from the lab.[1]
- Where
- Aix-Marseille University, France, with Paris's water utility.[1]
- Published
- 2024, as a doctoral thesis.[1]
Does reverse osmosis remove microplastics in the lab?
At the membrane, yes
In 2024, a scientist in France tested pieces of used RO membranes. One piece had deep creases, likely from use, the author thinks. The team fed about 10 million plastic particles to each piece. Not one test particle got through. Three larger flecks of the same plastic did turn up, but the team judged that they came from the lab.[1]
Even the creased piece held
The creased piece let some viruses through. Viruses are far smaller than the test particles. Yet the team judged that it still stopped each plastic test particle.[1]
What that tells you
A working membrane is a very good wall. If plastic turns up in RO water, ask how it got past, or in after.
Do home units work as well as the lab?
A home isn't a lab
Lab results are hard to match at home. Filters age, parts wear and upkeep slips. In 2023, scientists in Mosul, Iraq, went into real homes. They tested home filter units in 12 parts of the city. The authors describe an RO membrane as one of the stages.[2]
In Mosul, older units took out less plastic
A 5-stage unit one month old took out 82% of the plastic. A unit of the same kind, two years old, took out 30%. The paper doesn't say when each unit's filters were last changed. The authors think skipped upkeep was probably part of it. It's a small study, with one unit of each age and no blank tests reported.[2]
Real filters have seals
The French team tested small, flat pieces of membrane in a clamp, on purpose. It left out the rubber rings and glue that seal a real filter. When the team tested whole filters, some viruses got through, big and small alike. The author points to leaks at the rubber rings, called O-rings, or the glue, not to an intact membrane. That test was about viruses, not plastic. But it shows how a whole filter can do worse than a lab sample.[1]
Many units missed the mark on arsenic
Arsenic is far easier to measure than plastic, so arsenic tests give a good look at real home units. That's our reasoning. Arsenic gets into some well water naturally. In Nevada, a team tested 19 homes with RO. In 10 of them, the filtered water still held more arsenic than the US limit. One unit took out none at all. In Maine, most homes in the study that treat their well water for arsenic used under-sink RO. About 1 in 5 home systems there let arsenic through above the limit. Of the systems owners kept up, 20% failed. Of those a company kept up, 7% failed. Arsenic isn't plastic. But these are the same kind of filters, in real homes.[3, 4]
Upkeep slips
The EPA says most units need new pre-filters about every 6 months. They need a new membrane every 1 to 5 years. Over time, buildup on the membrane makes it remove less. In one study, families got a spare cartridge and reminder calls. About two years later, only about half had changed it. That was a different kind of filter.[5, 37]
An aging filter can even give plastic back
In a 2023 lab test in Toronto, scientists ran water with plastic in it through three common pour-through home filters. The one with no membrane sometimes let out more plastic than went in, from half its rated life onward. The two with a membrane did better, but plastic still turned up in their filtered water. None of them was RO.[25]
How much plastic did older units in Mosul take out?[2]
Does reverse osmosis add microplastics to water?
No proof either way
We found no study showing that a home RO unit adds plastic. We found none that ruled it out, either.
Plastic parts come after the membrane
After the membrane, water passes a valve, a tank, a carbon filter and a faucet. Makers' spec sheets show plastic tubing and tanks lined with plastic. We found no test of how much plastic, if any, those parts add.[37, 40, 41]
Filtered water machines still served plastic
In Italy, scientists tested two public filtered-water stations. One served 34 plastic particles per liter; the other had none. Two samples of local tap water had none in the sizes counted. The scientists think parts like rubber rings, valves and tubing were the likely source. In Indonesia, shops that clean water with RO still sold water with 6.5 to 9.5 bits per liter that looked like microplastics under a microscope. That was down from 15.5 to 19 in the water going in. Bits big enough to count that way can't pass an intact membrane. So they most likely got in at or after the filter. That's our reading; the paper doesn't say.[10, 11]
What happens to water after it's filtered?
Glass bottles, and still 300 times the plastic
A 2021 study followed water through four German bottling plants. The bottles were glass, with metal caps. Water fresh from the plants' filters held less than 1 plastic particle per liter. The washed bottles were clean too. Filled and capped, the bottles held 317 per liter on average. That's more than 300 times as much.[6]
Why? The cap.
So where did the plastic come from, in glass bottles? Each metal cap had a soft plastic seal inside. About 8 in 10 of the plastic bits matched that seal. Pressing a cap on and twisting it off rubs the seal against the rim. The authors point to capping and opening as the main ways plastic got in.[6]
Glass can help. It isn't a shield.
Many people trust glass. In one 2018 US test, water from one source held 204 particles per liter in glass bottles, against 1,410 in plastic ones, by the team's count. But that was one batch of each, and the glass bottles had plastic caps. Other teams have found more plastic in water from refillable glass bottles than from throwaway plastic ones. Glass bottles still have caps, and the German plants show what a cap can add.[6, 7]
What it means for your water
This was mineral water, not RO water at home. But it shows that clean water can pick plastic back up after the filter. Your RO water often takes a trip too: into a bottle or tumbler, under a lid, for hours. We found no study of how much plastic that adds.[6]
Plastic settles from the air, too
In China, scientists set small glass dishes out in offices, restaurants and homes. After 30 minutes, plastic bits from the air had settled in. Keeping a cup covered between sips would cut the plastic people swallow from the air by more than 60%, they estimate.[12]
How much plastic was in the capped bottles?[6]
How much of your water comes from your RO tap?
On days out, most water is drunk away from home
We ran the numbers from the CDC's newest food survey, from 2021 to 2023. On days people drank water away from home, they drank about 70% of that day's water there. The survey can't tell how much of it was carried from home. For ages 45 to 64, it was about the same.[18]
Half of it is bottled
Away from home, about half the water adults drank came in a bottle. On a given day, about 4 in 10 adults drank bottled water. A federal report found the same half-and-half split back in 2005 to 2008.[18, 19]
Even the cup counts
In a 2024 lab test, single-use cups filled with clean water released 126 to 1,420 bits per liter that looked like microplastics under a microscope. Even a cold paper cup lined with plastic, filled and checked right away, had 126. Hot water made it worse.[24]
Is bottled water made with reverse osmosis?
Often, yes
Under US rules, bottled water sold as "purified" can be made with RO. If it started as city tap water, the label doesn't have to say so. The two top-selling US bottled waters in 2018 both say, in their makers' own reports, that they use city water and RO.[7, 20, 21, 22]
All 30 purified-water bottles held plastic
In 2018, a New York team tested three purified waters sold in the US. Those two were among them. All 30 bottles held particles the team counted as plastic, by our tally of their table. Across all the brands they tested, 93% of 259 bottles showed plastic. The most common kind was polypropylene, a plastic used in many bottle caps. Bottled water held about twice as many larger plastic particles as tap water from around the world did in the team's earlier study: 10.4 per liter, against 5.45.[7]
Heat and shaking made it worse
A 2026 lab test tried 8 popular US bottled waters. Heat plus shaking made them release up to 9 times more tiny particles. Think of a bottle rolling around a hot car. The scientists traced plastic ones to the bottle and the cap.[8]
What does a normal day look like?
Picture a normal day. A glass from your RO tap at breakfast. A bottle from the gas station. A paper cup at the water cooler. A glass of water at lunch. The bottle that rode around in a warm car all afternoon.
Your RO cleaned the first glass. The rest came from somewhere else, or sat in plastic after the filter.
Why does plastic in water matter?
Scientists keep finding plastic inside people. In 2024, surgeons in Italy found plastic in the neck arteries of 58% of their patients. Those patients were 4.5 times more likely to have a heart attack or stroke, or die, within about 3 years. We walk through that study in our heart article.[16]
In China, doctors found plastic in 80% of the blood clots they pulled from patients. Read more in our blood clot article.[17]
In 2026, the EPA added microplastics to its draft list of drinking-water contaminants to study, as a first step.[48]
Do I need to double filter my water?
What if you fill your tumbler straight from your RO tap?
Good habit. That water left a working membrane about as clean as home equipment gets. But a lot can happen between the membrane and your lips.
Your filter ages quietly
You can't see a membrane or a seal start to slip, as the studies above show. And a TDS meter reads dissolved salts, not plastic.[42]
Many parts after the membrane are plastic
Your water still passes a tank, tubing, valves and a faucet. We found no test of what they add.[37]
Your lid twists and rubs
In a 2021 lab test, water bottles with plastic caps shed tiny bits at the neck and cap over 100 openings, some of them plastic. Bottles with plastic bodies shed more than glass ones. We found no test of tumbler lids.[23]
Experts use more than one barrier
The World Health Organization says water is safer with "multiple barriers" in place. If one fails, the others can make up for it. US drinking-water law works the same way. Health Canada says each barrier on its own can fall short. It even counts the pipes in your home as part of the water system.[28, 29, 30]
You already think this way
You likely bought your RO for an extra layer of protection. In a water-industry survey, that was the top concern of people who bought pricier home systems, RO among them.[43]
The last step is the one you carry
Your RO cleans water at the membrane. A filter at the sip is the last step, after the tank, the tubing, the lid, the car and the desk. It's a step you control, wherever you are. Away from home, it's often filtering water your RO never touched. The agencies write about whole water systems, not personal filters. Bringing their idea to your cup is our step. But the logic holds: no single filter covers every sip.
Can a filter go where you go?
That's why we made the Aelo Straw. It sits at the very last step: it's the last thing your water passes through before you drink it.
It's a portable filter straw for the bottles, tumblers and cups you already love. It removes up to 90% of the microplastics from your drinking water as you sip. It's lab-tested on particles down to 0.5 microns (500 nanometers), and we publish the test. Read the lab report.
It goes where your RO can't: the office, the gym, the car, a trip. Setup takes less than a minute.
It's been awarded multiple patents. Your first one or two sips take a little extra effort while the filter primes. After that, it's easy. We guarantee the Aelo Straw is easier to drink through than any other filter straw on the market.
It's designed for water. Each filter lasts 30 days. The Aelo Straw comes to market November 1.
So should you keep your reverse osmosis?
Yes. Keep it, and keep its filters fresh. For the water at your kitchen tap, it's one of the best tools you can own.
Just know where its job ends: at the faucet. On the way there, your water passes a tank and tubing. After that, it meets bottles, caps, cups and the air. And on days people drink water away from home, they drink about 70% of that day's water there.[18]
Filter your water as well as you can. Then make the last step yours: a barrier that goes where you go.
How did they find the plastic?
Most teams caught the particles on a fine filter. Then they used infrared light to tell plastics apart. The Mosul team counted by eye under a microscope. The New York team stained particles with a dye to count them. Each team used a different filter or size limit, so their counts can't be compared.[1, 2, 6, 7]
What this proves, and what it doesn't
What these studies show
- An intact RO membrane should let nothing solid through, the WHO says. In a lab test, used membranes, one of them creased, stopped every plastic test particle.[1, 26]
- Real home units vary. Older units in Mosul took out less plastic. Many units in Nevada and Maine let arsenic through.[2, 3, 4]
- Clean water picked up plastic after the filter, even in glass. Capped glass bottles held 317 particles per liter, against less than 1 before bottling.[6]
- Purified bottled water still held plastic, by one team's count: all 30 bottles from three brands (our tally of their table), two of which say they use RO.[7, 21, 22]
- On days people drink water away from home, they drink about 70% of that day's water there. That's our count of a US survey.[18]
What these studies did not prove
- What a typical home unit delivers. We found no study of home RO faucets with clean controls.[2]
- That RO stops nanoplastics in real use. These are plastic particles smaller than a micron, far smaller than the French test particles.[1]
- That home units or their membranes add plastic. We found no study that tested it.[9, 13, 14]
- How much plastic tumbler lids add. We found no study that tested them.[23]
- Exactly when plastic got into the German bottles. Uncapped bottles were tested at one plant only.[6]
- That these particles harm health. Studies in people show links, not proof of harm. In 2019, the WHO said there was not enough information to be sure.[16, 27, 48]
- That filtering your drinking water lowers the plastic in your body. We found no study that tested this for any filter.
- How RO owners drink. Our count of the US survey covers all adults. The survey last asked about home RO in 2009 to 2010.[18]
- That counts compare across studies. Each team used a different filter or size limit.[2, 7]
Questions readers are asking
Does reverse osmosis remove nanoplastics?
Nanoplastics are the plastic particles smaller than a micron. In theory, the holes in a reverse osmosis membrane are small enough to stop them. But we found no study that counted them before and after the membrane. Damage matters too: one creased piece in a French test let some viruses through.[1, 31]
Does reverse osmosis water still have microplastics?
Fresh from a working membrane, it should hold very little, judging by lab tests. We found no study that tested home reverse osmosis faucets with clean controls. And after the water leaves the faucet, it can pick plastic back up, as water in capped bottles did at German bottling plants.[1, 6]
Do reverse osmosis membranes shed plastic?
We found no study that showed this. Two bottled-water studies found polyamide particles. Polyamide is the plastic family that includes nylon and the top layer of reverse osmosis membranes. The authors named membranes as one possible source, but neither study tested one. Polyamide also turned up at a Danish plant with no membrane at all. In a French test of the membranes, stray plastic particles, polyamide among them, showed up in the clean water. The author suggested a polyamide hose, warm weather and room air as causes, but could not rule out the membrane's own plastic backing.[1, 13, 14, 15]
Is reverse osmosis certified to remove microplastics?
Not as a group. NSF/ANSI 58, the main standard for home RO units, has no microplastics claim on its list. A separate standard, NSF/ANSI 401, has one. It is tested with fine dust, not plastic. A unit must cut particles from half a micron to 1 micron by 85%. A few reverse osmosis models are also certified to 401, so look up the exact model.[44, 45, 46, 47]
Does bottled water made with reverse osmosis have microplastics?
Often, yes. Under US rules, "purified" bottled water can be made with reverse osmosis. In a 2018 test, all 30 bottles from three purified brands held particles the team counted as plastic. Two of those brands say they use reverse osmosis. The plastic most likely got in after the membrane, from the bottle, the cap or the bottling line. That's our reading of the studies.[7, 20, 21, 22]
Can a TDS meter tell if reverse osmosis removes microplastics?
No. A TDS meter reads the salts dissolved in water, by how well the water carries electricity. Plastic particles aren't dissolved salts, so the meter can't see them. A good reading tells you the membrane still blocks salts. It doesn't tell you about plastic, germs or PFAS. That's our reasoning; we found no study that tested it.[42]
How often should you change reverse osmosis filters?
Follow your maker's schedule. In most cases, the EPA says, pre-filters need changing about every 6 months and the membrane every 1 to 5 years. The EPA also suggests draining the tank about every 2 weeks, and many makers advise cleaning it once a year. In the Mosul study, older units took out less plastic.[2, 37]
Does reverse osmosis waste water?
Yes, though how much depends on the unit. The EPA says a typical home unit sends 5 gallons or more down the drain for every gallon it makes. Units with the EPA's WaterSense label must send 2.3 gallons or less.[36]
Why not just carry reverse osmosis water in a steel bottle?
It's a good habit, and it covers the water you pour yourself. But many lids are plastic. We found no test of steel-bottle lids, but in the German bottling study, the cap was the main source of plastic. And a bottle doesn't cover the water you didn't pour: the glass at a restaurant, the office cooler, the bottle you buy when yours runs dry.[6]
Do I still need a filter if I have reverse osmosis?
At home, your unit covers one tap. Away from home, it can't come with you. On days people drink water away from home, they drink about 70% of that day's water there, and about half of the water drunk away from home is bottled, by our count of a US survey. And water can pick plastic back up after any filter. A filter at the sip reaches the water your RO never touches.[6, 18]
About Aelo
Lab-tested on particles down to 0.5 microns (500 nanometers). Aelo's products are not connected to this research.
The technical record
Everything above is the story. Everything below is the paperwork: the exact statistics as published, the study’s own fine print, and the parts only a methods reviewer will want.
The numbers, exactly as published
| At the membrane, yes | Doctoral thesis, Aix-Marseille University, defended 27 November 2024. PMMA particles 38 to 45 µm, about 10^7 per membrane piece in 3 L at 12 bar; retention "totale" for every piece, at least 7 log, counting 3 larger PMMA particles as lab contamination. |
|---|
The fine print: the French membrane test
Design: a doctoral thesis on low-pressure reverse osmosis for drinking water, Aix-Marseille University, with Eau de Paris as research partner, defended 27 November 2024 (CC BY-NC-ND 4.0). Used membrane pieces from a lab pilot and a 3-stage semi-industrial pilot, plus new pieces; 3 pieces per membrane tested (positions 1, 5 and 9). The defects were found when the used modules were unrolled, not made by the team: one piece carried major folds, most likely formed in use (the author could not say for certain), and one carried a glued repair patch made during manufacture. The test cell held flat pieces, a set-up chosen so that micro-leaks through seals could not affect the result. No funding statement.[1]
Tests: about 10^7 PMMA particles of 38 to 45 µm per piece, in 3 L at 12 bar; permeate caught on 25 µm then 13 µm steel filters and read by µFTIR. Blanks: room air (1 to 8 particles per replicate), 1 L ultrapure water (3 to 9 particles), and recirculation in the pilot (no rise); no PMMA in any blank.[1]
Results: no test particle in any permeate except 3 larger PMMA particles (74.3, 74.9 and 108.5 µm), judged to be lab contamination; retention total for every piece, at least 7 log. Stray particles of other plastics: 1 to 9 per sample (34 to 168 µm) for lab-pilot pieces, in line with the blanks; more for larger-pilot pieces (roughly 0 to 52 per liter by chart reading, new pieces included), with the polyamide permeate hose, warm weather and room air offered as possible causes, and release from the membrane's plastic backing a possibility still to be confirmed. The folded piece: salt retention fell to 75.5% and viruses passed (5.4 log retention); plastic retention stayed total. Surface cracks measured 1 to 2 µm. In separate tests of whole spiral-wound modules, virus passage into the permeate did not depend on virus size, which the author traces most plausibly to the modules' O-rings and possibly their glue lines, not to an intact membrane (viruses, not plastic).[1]
Limits: the test particles were far larger than the 1 to 2 µm cracks, so the test says nothing about the smallest microplastics or nanoplastics; flat pieces in a lab cell, not a home unit with its seals; a thesis examined by a jury rather than a journal (the journal version, 2025, is abstract only for us).[1]
The fine print: home purifiers in Mosul, Iraq
Design: 24 water samples in triplicate from 12 districts of Mosul, August to December 2023, taken before and after each home's purifier in 1 L glass bottles. Units were 7 to 730 days old with 5 to 8 stages, one unit per district. The paper describes a reverse osmosis membrane as stage 4 of its 8-stage example and explains its results by that membrane, but does not say which stages each unit has. Age is given as "Filter's age (days)" in Table 1, without saying whether it counts from installation or from the last cartridge or membrane change; the paper reports no maintenance or replacement data.[2]
Tests: particles caught on a 0.45 µm filter and counted by eye under a stereomicroscope, with SEM for size and FTIR for polymer type.[2]
Results: removal of 93% (8-stage, 7 days) down to 30% (5-stage, 730 days), falling with age in every stage group; the authors say the causes are "probably" the membranes' own plastic and fouling when upkeep is skipped. Treated water held mostly fibers and fragments; 35% of particles were 10 µm or smaller and 19% were 100 to 200 µm; PVC made up 58%, and the authors note that most of the city's water network is PVC.[2]
Limits: no blank or contamination controls are described; counts by eye under a microscope; one unit per age and stage, so age and stage count are tangled; the paper does not confirm that every unit had a reverse osmosis membrane. The large particles and the PVC share suggest that many got around the membrane, entered after it or came in during sampling, which the paper does not test. No funding statement. Open access, CC BY 4.0.[2]
The fine print: arsenic in homes with reverse osmosis
Nevada, 2005 (George 2006): homes on private wells with high arsenic that used reverse osmosis units; water sampled before and after each unit. Filtered water was above 10 µg/L in 10 of 19 homes and above 100 µg/L in 4; mean removal 79%, from a unit that removed essentially nothing to one that removed nearly all. Filter life span and upkeep were not recorded. Supported by NIEHS grants. Open access (PMC).[3]
Maine and New Jersey (Yang 2020): one-time samples of untreated and treated well water from 156 Maine and 94 New Jersey homes with arsenic treatment; most Maine homes used point-of-use reverse osmosis, most New Jersey homes whole-house systems. Failure, meaning treated water above the state limit (10 µg/L in Maine, 5 µg/L in New Jersey): 19% (29 of 156) and 16% (15 of 94). In Maine's 2006 to 2007 round, 20% of systems maintained by homeowners failed (13 of 65), against 7% of those maintained by a vendor (2 of 28), without a significance test; failure also rose with the arsenic level of the well. Funded by the NIEHS Superfund Research Program and the CDC. Author manuscript (PMC).[4]
Upkeep (Endres 2023): in Great Plains tribal communities, 51% (35 of 69) of participants lived in a household that reported changing its under-sink arsenic filter cartridge over a mean follow-up of 2.0 years, despite a spare cartridge and reminder calls (change advised every 12 months). An under-sink arsenic cartridge filter, not reverse osmosis; self-reported. Funded by the NIEHS (Strong Heart Water Study). Open access (CC BY).[5]
The fine print: the German bottling plants
Design: four mineral-water bottlers in Germany; still water only, in returnable glass bottles; five sample types along each line; particles 11 µm and up; 14 procedural blanks. Caps were varnished aluminum with a plastic sealing layer inside. Published March 2021; sampling dates are not given in the main text.[6]
Results: under 1 particle per liter after iron removal and filtering (0.019 to 0.053); cleaned bottles all below the detection limit (0 to 24 per liter; limit 40 per sample); filled but uncapped bottles at one bottler, 6 per liter, which the authors rate as clean; filled and capped bottles, 317 ± 257 per liter (75 to 700). 81% of the plastic particles resembled the polyethylene-based cap seal. The authors name capping and bottle opening as the main entry paths.[6]
Limits: glass bottles with aluminum caps, not reverse osmosis water or plastic bottles; 3 capped bottles per bottler; uncapped bottles at one bottler only. Funded by the Bavarian Research Foundation; two authors report competing interests. Open access, CC BY.[6]
The fine print: bottled water and reverse osmosis
Rules: under 21 CFR 165.110, "purified water" may be produced by distillation, deionization, reverse osmosis or other suitable processes, and water from a community system need not say "from a municipal source" when it is treated to that definition and labeled as such.[20]
Makers' own reports: a 2025 report for one best-selling brand says most of its plants use municipal water and that a high-pressure membrane step "is called reverse osmosis"; a 2023 report for another lists 17 US plants, all on public water and all listing reverse osmosis in treatment (our count).[21, 22]
Testing (Mason 2018, State University of New York at Fredonia): 259 bottles of 11 brands from 9 countries; 93% showed some sign of microplastics. In the three US purified-water lots, bought online, all 30 bottles held particles above the lab blank in the size class over 100 µm (our count from Table 2). Particles were stained with Nile Red and counted down to 6.5 µm; only those over 100 µm were checked by infrared, so the smaller counts rest on the dye alone. Bottled water held about twice as many particles over 100 µm as the team's earlier tap-water study (10.4 vs 5.45 per liter), the only size class the authors say compares. Polypropylene was the most common confirmed polymer (54%). The market analysis and purchases were arranged by Orb Media; its 2018 US sales ranking put the two brands that report using reverse osmosis first and second. No funding statement. Open access, CC BY.[7]
Handling (Hussain 2026, University of Nebraska-Lincoln): 8 of the most popular US single-use brands, 7 of them purified; combined heat and shaking raised nanoparticle counts up to 9.29-fold; Raman spectroscopy identified PET, polyethylene and polypropylene from both bottle body and caps. Counts are of all particles, not only plastic, and lab deionized water gave comparable counts. Funded by a University of Nebraska-Lincoln Grand Challenge project. Open access, CC BY.[8]
The fine print: where Americans drink their water
Our count (Aelo's analysis, not peer reviewed): NHANES August 2021 to August 2023, day-1 24-hour dietary recalls, plain tap and bottled water codes, weighted. "Away" means the person answered no to "Did you eat this meal at home?" for that drink. Adults 20 and over (n = 4,798): 25.6% of plain water drunk away from home; 30.8% drank some water away from home on the day, and among them, 70.1% of their plain water that day was drunk away from home (72.1% for ages 45 to 64). Away from home, 49% of adults' water was bottled; 41.3% of adults drank bottled water on the day. NHANES counts filtered tap water as tap water and has not asked about home reverse osmosis since 2009 to 2010, so these are figures for all Americans, not for owners. Method, code and file checksums are kept with our research files.[18]
Earlier, published: USDA's Food Surveys Research Group (2005 to 2008, everyone age 2 and over) found 31% of plain water drunk away from home, and tap water was "only one-half of the water consumed away from home". One fixture: EPA WaterSense describes a point-of-use reverse osmosis system as connected to a single fixture, such as under the kitchen sink.[19, 36]
The fine print: membrane units and filtered water machines
Geneva, 2024: a pilot nanofiltration unit (a polypropylene pre-filter and a polyethersulfone membrane, a looser membrane than reverse osmosis) on groundwater; 3 sampling campaigns of about 830 L in and 1,000 L out through a 20 µm sieve, with 5 field blanks. Particles: 8 ± 7 per cubic meter in groundwater (below the detection limit) against 36 ± 11 in nanofiltered water, which differed from the blanks. The membrane's own polymer was not found; the authors write that other plastic parts of the cartridge and system could release a few. Funded by a Swiss gas and water industry fund and the Geneva utility that runs the site; no competing interests declared. Open access, CC BY.[9]
Italy, 2026 (Galoppo): 10 samples, one per site, read by laser infrared imaging from 10 to 500 µm; an office dispenser with carbon, ion-exchange and microfiltration cartridges gave 4 particles per liter; one of two public filtered-water stations gave 34 per liter and the other none; two tap samples and all blanks held no particles. The authors link polyurethane to O-rings, valves and foams and polyamide to tubing and filter housings (an interpretation, not tested). No external funding. Open access, CC BY.[10]
Indonesia, 2026 (Sari): three refill shops using carbon, sand and reverse osmosis delivered 6.5, 9.0 and 9.5 particles per liter against 19.0, 16.5 and 15.5 in their raw water; samples taken in the shops' 19-liter PET jugs and counted under a microscope. Funded by Indonesia's Ministry of Higher Education, Science and Technology. Open access, CC BY.[11]
Parts after the membrane: EPA's diagram of a typical under-sink unit shows an automatic shut-off valve, a storage tank, a post carbon filter and a separate faucet; makers describe polyethylene tubing and tanks with a polypropylene liner.[37, 40, 41]
The fine print: open cups and air
Fang 2022 (Wenzhou Medical University with UC Davis; Journal of Hazardous Materials): triplicate glass petri dishes, 75 mm across, left open for 30 minutes in offices, restaurants, classrooms, dining halls and homes in one Chinese city; particles stained with Nile Red, with infrared checks on a sample. Offices received about 8.9 × 10^5 particles per square meter per day; the authors estimate that keeping a cup or bottle covered when not drinking would cut more than 60% of the load. Blanks were not subtracted, and the rates are far above some other studies. Funded by Chinese national and Zhejiang provincial science programs. Author copy on eScholarship.[12]
The fine print: the polyamide question
Columbia University, 2024: a laser imaging method estimated about 240,000 particles per liter in three bottled-water brands bought from a large retailer, about 9 in 10 of them under 1 µm (extrapolated from imaged fields). Polyamide was the most common plastic by count in 2 of the 3 brands (63% and 49%) and third in the other (19%), by our reading of the paper's Figure 5D. The authors note that polyamide is the most popular reverse osmosis membrane material. A published letter disputes the blank, and the team's own lab water held polyamide too. Funded by Columbia's RISE program, the Hudson River Foundation and two NIEHS centers; no competing interests declared.[13]
Zhejiang University, 2026: polyamide was 6.7% of particles in three Chinese brands, described as corresponding to reverse osmosis membrane fragments by size and shape. Neither study tested a membrane, and whether their lab tests would recognize a membrane's polyamide is not settled. Funded by national science programs in China, the Russian Science Foundation and Zhejiang province.[14]
Denmark, 2023: polyamide made up a mean 78% of the plastic by count at the outlets of a drinking-water plant with no membrane (aeration and sand filters only), so polyamide in treated water does not by itself point to a reverse osmosis membrane. Funded by the EU's Horizon 2020 program (Marie Sklodowska-Curie grant MONPLAS); no conflicts declared.[15]
The fine print: health studies and the barrier principle
Arteries (Marfella 2024, New England Journal of Medicine): 304 patients having surgery on a narrowed neck artery in Italy were enrolled and 257 completed a mean follow-up of about 34 months; polyethylene was found in the removed plaque of 150 (58.4%). A heart attack, stroke or death occurred in 20% of patients with plastic against 7.5% without (hazard ratio 4.53). An observational study; the authors write that their results do not prove causality. Funded by Italian public research grants, the Italian Ministry of Health and the NIH.[16]
Blood clots (Wang 2024, eBioMedicine): clots removed from 30 patients with stroke, heart attack or deep-vein clots in Shantou, China; microplastics in 24 of 30 (80%). Funded by Shantou University Medical College grants and the Li Ka Shing Foundation. Covered in full in our blood clot article.[17]
Barriers: WHO's Guidelines for Drinking-water Quality (2022) base safety on "multiple barriers, from catchment to consumer" and note that a failure of one barrier may be compensated by the others; the EPA's 2004 guide to the Safe Drinking Water Act says the law "sets up multiple barriers against pollution"; Health Canada says each barrier may not completely remove or prevent contamination and calls the plumbing inside a home an extension of the distribution system. These agencies write about whole water systems (the WHO's "safer" line is in its section on germs), and none recommends personal filters; carrying the idea to a filter at the sip is our framing.[28, 29, 30]
Who buys home systems: in the Water Quality Association's 2023 consumer survey (a trade group whose members sell treatment equipment; online, 1,412 adults), buyers of higher-priced systems, reverse osmosis included, were primarily concerned with adding an extra layer of protection. EPA estimates about 1 million point-of-use reverse osmosis units are sold in the US each year and has no count of units in use.[38, 43]
The fine print: the agencies and standards
How reverse osmosis works, the stages, the waste water and upkeep: US EPA WaterSense pages and report EPA 832-F-24-025 (November 2024; upkeep intervals hold "in most cases", depending on local water quality and use; draining the tank about every two weeks and yearly sanitizing are on p.6). What it removes: CDC, "About Home Water Treatment Systems" and "About Choosing Home Water Filters" (April 2024); Minnesota Department of Health (2018); EPA Science Matters on PFAS (2018); EPA WaterSense Guide to Selecting Water Treatment Systems (taste and odor). Chlorine and the membrane: GE owner's manual (2009). TDS meters read conductivity: Water Quality Association fact sheet (2019). Microplastics as 1 to 5,000 µm, and the NSF/ANSI 401 test (85% reduction of 0.5 to under 1 µm test dust): NSF staff column, Water Conditioning & Purification, September 2021, with the claim's adoption reported in January 2022. NSF/ANSI 58 claims list: NSF Knowledge Library.[31, 32, 33, 34, 35, 36, 37, 39, 42, 44, 46, 47]
Health positions: WHO 2019 information sheet (not enough information for firm conclusions; no reliable information that the particles are a concern); EPA draft Contaminant Candidate List 6 (signed 2 April 2026), which lists microplastics as a group "as a first step" and says listing does not mean a rule will follow. The EPA's news release that day said the final list is expected to be signed by 17 November 2026.[27, 48, 49]
The fine print: cups, caps and an aging filter
Glass vs plastic (Mason 2018): of all lots, one brand came in glass as well as plastic from the same water source; by Nile Red counts, 204 particles per liter in glass against 1,410 in plastic. Both had plastic caps; most of the gap was in small particles counted by dye alone (over 100 µm: 8.96 against 14.8 per liter). One lot each, bought in different places.[7]
Single-use cups (Akbulut 2024, Foods): polypropylene, polystyrene, polyethylene-coated paper and foam cups filled with ultrapure water at 4, 50 and 80 °C for 0 to 20 minutes; 126 to 1,420 particles per liter, lowest in the coated paper cup at 4 °C and 0 minutes, highest in polypropylene at 50 °C for 20 minutes; hot water released significantly more than cold, and rinsing a cup first cut release by 52 to 65%. Cups were rinsed before the main tests. Particles were counted by eye at 10 times under a microscope; their polymer was not identified. No external funding. Open access, CC BY.[24]
Caps (Song 2021, Environmental Science and Pollution Research): feeding and water bottles with plastic caps were opened and closed 100 times, and the neck and cap were rinsed with ethanol; 53 to 393 particles per mL of the collected sample (the rinse, dried and made up to 2 mL); 7.5 to 42.1% of the identified particles were plastic; bottles with plastic bodies shed more than glass-bodied ones. Particles were counted in the rinse, not in drinking water, and no tumbler lid was tested. Funded by the National Natural Science Foundation of China-Henan Joint Fund and Henan provincial and university grants; no competing interests declared.[23]
Aging pour-through filters (Cherian 2023, Polymers, University of Toronto): three pour-through home devices, all meeting NSF/ANSI 42 and 53, were fed water spiked with PVC, PET and nylon; in the carbon and resin device, PET in the effluent exceeded the influent at 75% of rated capacity and PVC at 50 to 125%; plastic was also found in the effluent of the two membrane devices. Two units of each device; test fragments about 80 to 100 µm and fibers about 0.8 mm. Not reverse osmosis. Funded by Canada's Natural Sciences and Engineering Research Council (NSERC Chair in Drinking Water Research, University of Toronto); no conflicts declared. Open access, CC BY.[25]
The fine print: funding, conflicts and how we checked
Every number on this page was checked against the study's full text and recorded in a fact sheet for each study, and every sentence was fact-checked again before review. Open-access papers behind a robot check, abstract-only papers and paywalled papers were not used. The figures on where Americans drink water are our own analysis of public CDC survey data; the page says so where the figure is introduced, in the Short Summary, the FAQ and What this proves, and every use cites it. Funding is listed in each study's record where the study states it. Aelo received no funding for this review and has no financial relationship with any study, its authors or its funders.[6, 9]
Sources
- Taligrot H. Production d'eau potable par osmose inverse basse pression. Doctoral thesis, Aix-Marseille Université; 2024 (defended 27 November 2024). theses.fr 2024AIXM0421. CC BY-NC-ND 4.0. Production d'eau potable par osmose inverse basse pression
- Altaee RN, Al-Ahmady KK, Mhemid RKS. Study the effectiveness of household water filtration systems in eliminating plastic particles in Mosul City, Iraq. J Ecol Eng. 2024;25(9):24-33. doi:10.12911/22998993/190106. Study the Effectiveness of Household Water Filtration Systems in Eliminating Plastic Particles in Mosul City, Iraq
- George CM, Smith AH, Kalman DA, Steinmaus CM. Reverse osmosis filter use and high arsenic levels in private well water. Arch Environ Occup Health. 2006;61(4):171-175. doi:10.3200/AEOH.61.4.171-175. PMCID PMC3849398. Reverse Osmosis Filter Use and High Arsenic Levels in Private Well Water
- Yang Q, Flanagan SV, Chillrud S, Ross J, Zeng W, Culbertson C, Spayd S, Backer L, Smith AE, Zheng Y. Reduction in drinking water arsenic exposure and health risk through arsenic treatment among private well households in Maine and New Jersey, USA. Sci Total Environ. 2020;738:139683. doi:10.1016/j.scitotenv.2020.139683. PMCID PMC7429269. Reduction in drinking water arsenic exposure and health risk through arsenic treatment among private well households in Maine and New Jersey, USA
- Endres K, Zacher T, Richards F, et al. Behavioral determinants of arsenic-safe water use among Great Plains Indian Nation private well users. Environ Health. 2023;22:42. doi:10.1186/s12940-023-00965-0. PMCID PMC10183246. Behavioral determinants of arsenic-safe water use among Great Plains Indian Nation private well users
- Weisser J, Beer I, Hufnagl B, Hofmann T, Lohninger H, Ivleva NP, Glas K. From the well to the bottle: identifying sources of microplastics in mineral water. Water. 2021;13(6):841. doi:10.3390/w13060841. From the Well to the Bottle: Identifying Sources of Microplastics in Mineral Water
- Mason SA, Welch VG, Neratko J. Synthetic polymer contamination in bottled water. Front Chem. 2018;6:407. doi:10.3389/fchem.2018.00407. PMCID PMC6141690. Synthetic Polymer Contamination in Bottled Water
- Hussain KA, Dong H, Tamayo-Aguilar A, Kim S, Pena CAG, Foss S, Fernandez-Ballester L, Lu Y, Li Y. Everyday storage and handling of PET bottled water increase human exposure to nano- and microplastics: influence of socio-economic factors. Water Res. 2026;295:125569. doi:10.1016/j.watres.2026.125569. PMCID PMC13543205. Everyday storage and handling of PET bottled water increase human exposure to nano- and microplastics: Influence of socio-economic factors
- Negrete Velasco A, Ellero A, Ramseier Gentile S, Zimmermann S, Ramaciotti P, Stoll S. Impact of a nanofiltration system on microplastic contamination in Geneva groundwater (Switzerland). Environ Sci Pollut Res Int. 2024;31(9):13512-13522. doi:10.1007/s11356-024-31940-y. PMID 38253831. PMCID PMC10881595. Impact of a nanofiltration system on microplastic contamination in Geneva groundwater (Switzerland)
- Galoppo S, Fenti A, Falco G, Chianese S, Marfella LV, Musmarra D, Barceló D, Iovino P. Integrating LDIR spectroscopy for assessing exposure to microplastics in drinking water: a preliminary study. Environments. 2026;13(8):447. doi:10.3390/environments13080447. Integrating LDIR Spectroscopy for Assessing Exposure to Microplastics in Drinking Water: A Preliminary Study
- Sari GL, Amanah N, Amala Z, Kurniawan SB, Novembrianto R, Fauzi M, Rohmana AS, Amethysia NR, Cahyaningrum PS, Nainggolan AM. Microplastic occurrence and removal in unbranded refilled drinking water treatment systems: implications for human exposure in Karawang, Indonesia. J Ecol Eng. 2026;27(8):70-81. doi:10.12911/22998993/220133. Microplastic occurrence and removal in unbranded refilled drinking water treatment systems: Implications for human exposure in Karawang, Indonesia
- Fang M, Liao Z, Ji X, et al. Microplastic ingestion from atmospheric deposition during dining/drinking activities. J Hazard Mater. 2022;432:128674. doi:10.1016/j.jhazmat.2022.128674. Author copy: eScholarship. Microplastic ingestion from atmospheric deposition during dining/drinking activities
- Qian N, Gao X, Lang X, Deng H, Bratu TM, Chen Q, Stapleton P, Yan B, Min W. Rapid single-particle chemical imaging of nanoplastics by SRS microscopy. Proc Natl Acad Sci U S A. 2024;121(3):e2300582121. doi:10.1073/pnas.2300582121. PMID 38190543. PMCID PMC10801917. Rapid single-particle chemical imaging of nanoplastics by SRS microscopy
- Deng X, Zhang Y, Tang X, Lee HJ, Zhang D. Single-particle mid-infrared photothermal imaging reveals hidden heterogeneity in real-world micro- and nanoplastics. Adv Sci (Weinh). 2026;13(41):e24291. doi:10.1002/advs.202524291. PMID 42043841. PMCID PMC13335550. Single-Particle Mid-Infrared Photothermal Imaging Reveals Hidden Heterogeneity in Real-World Micro- and Nanoplastics
- Maurizi L, Iordachescu L, Kirstein IV, Nielsen AH, Vollertsen J. Do drinking water plants retain microplastics? An exploratory study using Raman micro-spectroscopy. Heliyon. 2023;9(6):e17113. doi:10.1016/j.heliyon.2023.e17113. PMID 37484254. PMCID PMC10361326. Do drinking water plants retain microplastics? An exploratory study using Raman micro-spectroscopy
- Marfella R, Prattichizzo F, Sardu C, et al. Microplastics and nanoplastics in atheromas and cardiovascular events. N Engl J Med. 2024;390(10):900-910. doi:10.1056/NEJMoa2309822. PMID 38446676. PMCID PMC11009876. Microplastics and Nanoplastics in Atheromas and Cardiovascular Events
- Wang T, Yi Z, Liu X, Cai Y, Huang X, Fang J, Shen R, Lu W, Xiao Y, Zhuang W, Guo S. Multimodal detection and analysis of microplastics in human thrombi from multiple anatomically distinct sites. EBioMedicine. 2024;103:105118. doi:10.1016/j.ebiom.2024.105118. PMID 38614011. PMCID PMC11021838. Multimodal detection and analysis of microplastics in human thrombi from multiple anatomically distinct sites
- Aelo analysis of US National Health and Nutrition Examination Survey (NHANES) public data, August 2021 to August 2023, day-1 dietary recall files DR1IFF_L, DR1TOT_L, DEMO_L and DRXFCD_L (CDC National Center for Health Statistics). Not peer reviewed. NHANES August 2021-August 2023 Dietary Data, Individual Foods, First Day (DR1IFF_L)
- Sebastian RS, Wilkinson Enns C, Goldman JD. Drinking water intake in the U.S.: What We Eat in America, NHANES 2005-2008. Food Surveys Research Group Dietary Data Brief No. 7. US Department of Agriculture; September 2011. Drinking Water Intake in the U.S.: What We Eat in America, NHANES 2005-2008
- US Food and Drug Administration. 21 CFR 165.110, Bottled water. Electronic Code of Federal Regulations (current). 21 CFR 165.110 Bottled water
- The Coca-Cola Company. DASANI bottled water report, as required by California SB 220. 22 May 2025. DASANI Bottled Water Report
- PepsiCo. Aquafina bottled water information and sample water quality analysis. Updated July 2023. Aquafina Water Quality Analysis
- Song K, Ding R, Sun C, Yao L, Zhang W. Microparticles and microplastics released from daily use of plastic feeding and water bottles and plastic injectors: potential risks to infants and children in China. Environ Sci Pollut Res Int. 2021;28(42):59813-59820. doi:10.1007/s11356-021-14939-7. PMCID PMC8214457. Microparticles and microplastics released from daily use of plastic feeding and water bottles and plastic injectors: potential risks to infants and children in China
- Akbulut S, Akman PK, Tornuk F, Yetim H. Microplastic release from single-use plastic beverage cups. Foods. 2024;13(10):1564. doi:10.3390/foods13101564. PMCID PMC11121293. Microplastic Release from Single-Use Plastic Beverage Cups
- Cherian AG, Liu Z, McKie MJ, Almuhtaram H, Andrews RC. Microplastic removal from drinking water using point-of-use devices. Polymers (Basel). 2023;15(6):1331. doi:10.3390/polym15061331. PMID 36987112. PMCID PMC10054062. Microplastic Removal from Drinking Water Using Point-of-Use Devices
- World Health Organization. Microplastics in drinking-water. Geneva: WHO; 2019. ISBN 978-92-4-151619-8. Microplastics in drinking-water
- World Health Organization. Microplastics in drinking-water: information sheet. Geneva: WHO; 22 August 2019. Microplastics in drinking-water: information sheet
- World Health Organization. Guidelines for drinking-water quality: fourth edition incorporating the first and second addenda. Geneva: WHO; 2022. ISBN 978-92-4-004506-4. Guidelines for drinking-water quality, fourth edition incorporating the first and second addenda
- US Environmental Protection Agency, Office of Water. Understanding the Safe Drinking Water Act. EPA 816-F-04-030. June 2004. Understanding the Safe Drinking Water Act
- Health Canada. Drinking water and health: overview. Page dated 5 December 2025. Drinking water and health
- US Centers for Disease Control and Prevention. About home water treatment systems. Updated 10 April 2024. About Home Water Treatment Systems
- US Centers for Disease Control and Prevention. About choosing home water filters. Updated 10 April 2024. About Choosing Home Water Filters
- Minnesota Department of Health. Water treatment units for arsenic reduction. 2018. Water Treatment Units for Arsenic Reduction
- US Environmental Protection Agency. Reducing PFAS in drinking water with treatment technologies. Science Matters, 23 August 2018 (updated 19 February 2026). Reducing PFAS in Drinking Water with Treatment Technologies
- US Environmental Protection Agency, WaterSense. Guide to selecting water treatment systems. EPA 832-F-24-024. November 2024 (file dated January 2025). Guide to Selecting Water Treatment Systems
- US Environmental Protection Agency, WaterSense. Point-of-use reverse osmosis systems. Point-of-Use Reverse Osmosis Systems
- US Environmental Protection Agency, WaterSense. Treating water with less waste: reverse osmosis systems. EPA 832-F-24-025. November 2024. Treating Water With Less Waste: Reverse Osmosis Systems
- US Environmental Protection Agency, WaterSense. Specification for point-of-use reverse osmosis systems: supporting statement, version 1.0. November 2024. WaterSense Specification for Point-of-Use Reverse Osmosis Systems Supporting Statement
- GE Appliances. Reverse osmosis filtration system GXRM10RBL: owner's manual and installation instructions, 49-50237-2. 2009. GE Reverse Osmosis Filtration System Owner's Manual
- John Guest. LLDPE polyethylene tubing (product page). LLDPE Polyethylene Tubing
- Neologic Solutions. neoPure reverse osmosis tanks sell sheet. 2025. neoPure Reverse Osmosis Tanks
- Water Quality Association. Reverse osmosis (RO) fact sheet. 2019. Reverse Osmosis (RO) Fact Sheet
- Water Quality Association. National study of consumers' opinions and perceptions regarding water quality, 2023 edition: summary and highlights. Consumer Opinion Study 2023
- NSF. NSF/ANSI 58: reverse osmosis drinking water treatment systems. NSF Knowledge Library. NSF/ANSI 58: Reverse Osmosis Drinking Water Treatment Systems
- NSF. Certified drinking water treatment units: NSF/ANSI 401 microplastics reduction listings. Listings current as of 16 October 2026. NSF Listings, Drinking Water Treatment Units
- Andrew R. Microplastics reduction testing. Water Conditioning & Purification. 15 September 2021. Microplastics Reduction Testing
- Andrew R. Update on microplastics reduction claims. Water Conditioning & Purification. 14 January 2022. Update on Microplastics Reduction Claims
- US Environmental Protection Agency. Drinking Water Contaminant Candidate List 6, draft. Pre-publication notice, signed 2 April 2026. Docket EPA-HQ-OW-2022-0946. Drinking Water Contaminant Candidate List 6-Draft
- US Environmental Protection Agency. EPA takes bold action to ensure drinking water is safe from microplastics, pharmaceuticals, and potential hidden contaminants. News release, 2 April 2026. EPA Takes Bold Action to Ensure Drinking Water is Safe from Microplastics, Pharmaceuticals, and Potential Hidden Contaminants