Surgeons found microplastics in the arteries of 58% of patients
At three hospitals in southern Italy, surgeons cleared blocked neck arteries in 257 patients and had the plaque tested for microplastics. A plastic signal showed up in 150 of them. The study followed all patients for nearly three years and found that the group with microplastics in their arteries had a higher combined risk of heart attack, stroke or death.[1, 2]
7 minute read · Updated · By Aelo Editorial

Short Summary
Surgeons at three hospitals in southern Italy cleared the fatty buildup out of 257 patients' neck arteries. Every piece went to a lab to be tested for microplastics. The lab found plastic in 150 of the 257. The researchers then watched all 257 for three years and counted every heart attack, stroke or death. In the group with plastic in their arteries, 1 in 5 had one. In the group without, 1 in 13. After adjusting for age, blood fats and other differences, the study's model estimated a hazard ratio of 4.53. Plastic in the artery wall, and a higher combined risk of heart attack, stroke or death. That figure is why this study went around the world, and it is why you are reading this.[1, 2, 3]
The study at a glance
- Patients
- 257 adults having neck surgery[1]
What they found
The comparison that made headlines
The most striking number in this study comes from one comparison. Look at the patients with microplastics in their arteries. Within three years, 1 in 5 had a heart attack, had a stroke, or died. Among the patients without, it was 1 in 13. The observed shares were 20.0% and 7.5%—a proportion ratio of about 2.7. Then the researchers accounted for age, blood fats, kidney measures and other health differences. Their model estimated an adjusted hazard ratio of 4.53.[1, 2]
Why the number went up, not down
Adjusting usually shrinks a headline number. Here it grew, and pick either number: the gap is substantial. The plastic group was younger to begin with. Younger patients should have fewer heart attacks. The reported hazard ratio was 2.84 before adjustment and 4.53 after accounting for age and the other listed factors.[1]
The close-up pictures[1, 6, 12]

Is this actually serious?[1, 2]
See the exact data behind this chart
| Measure | Value |
|---|---|
| In plain words | Among the 150 patients whose plaque carried a detected signal, 30 had a primary end-point event during follow-up, which the article states as 20.0% and 6.1 events per 100 patient-years. |
| Result | 30 of 150 patients in the signal-positive group had a composite event (20.0%; 6.1 events per 100 patient-years as published). |
| People with this result | 30 |
| People counted | 150 |
| In plain words | Among the 107 patients whose plaque produced no detected signal, 8 had a primary end-point event, stated as 7.5% and 2.2 events per 100 patient-years. |
| Result | 8 of 107 patients in the signal-negative group had a composite event (7.5%; 2.2 events per 100 patient-years as published). |
| People with this result | 8 |
| People counted | 107 |
| In plain words | After adjustment for eleven listed covariates, the Cox model reported a hazard ratio of 4.53 with a 95% confidence interval from 2.00 to 10.27 and P less than 0.001 for the comparison between the signal-positive and signal-negative groups. |
| Result | Adjusted hazard ratio 4.53 (95% CI 2.00 to 10.27; P < 0.001); the interval spans a fivefold range, and the model fits twelve terms against 38 total events. |
| Direction | increase |
| In plain words | Before any covariate adjustment the same comparison gave a hazard ratio of 2.84 with a 95% confidence interval from 1.50 to 5.40 and a P value of 0.007, so adjustment moved the estimate upward rather than downward. |
| Result | Unadjusted hazard ratio 2.84 (95% CI 1.50 to 5.40; P = 0.007), materially smaller than the adjusted 4.53. |
| Direction | increase |
How did they find plastic inside an artery?
The lab froze, dried and burned a tiny piece of each sample, then read the chemical fragments that came off. That reads plastic by weight, not by counting pieces, and it cannot tell a microplastic from a smaller nanoplastic.[1, 6, 12]
Eleven kinds of plastic were on the test list. Two showed up. Polyethylene was in 150 of the 257 samples. PVC was in 31, and never on its own. The authors cannot explain why the other nine never appeared.[1, 2]
Each plastic has its own floor, the smallest amount the machine can reliably see. Polyethylene has the highest floor of the eleven. So how often each plastic turned up is partly a story about the equipment.[2]
Against contamination, the team worked under a fume hood with glass instead of plastic. They cleaned every surface with ethanol and ran a blank sample before each batch. The authors themselves say a clean room with no plastic in it at all would settle the question for good.[1, 2]
How does this even happen?[1]
The chicken versus the egg[6, 10, 12]

What other scientists are saying
Five letters ran in the same journal two months later, and the authors replied. Together they pressed on three things the study could not settle. Contamination. Where the plastic came from. Which way the arrow points.[6, 7, 8, 9, 10, 11, 12]
Two doctors in Krakow noted that operating rooms are full of the same two plastics. No blank sample was ever taken from the operating room itself.[6, 7]
A group in Amsterdam asked about the coatings that shed off catheters and stents. The authors answered that only 11 plastics were tested, and that the group was too small to chase sources.[6, 8, 12]
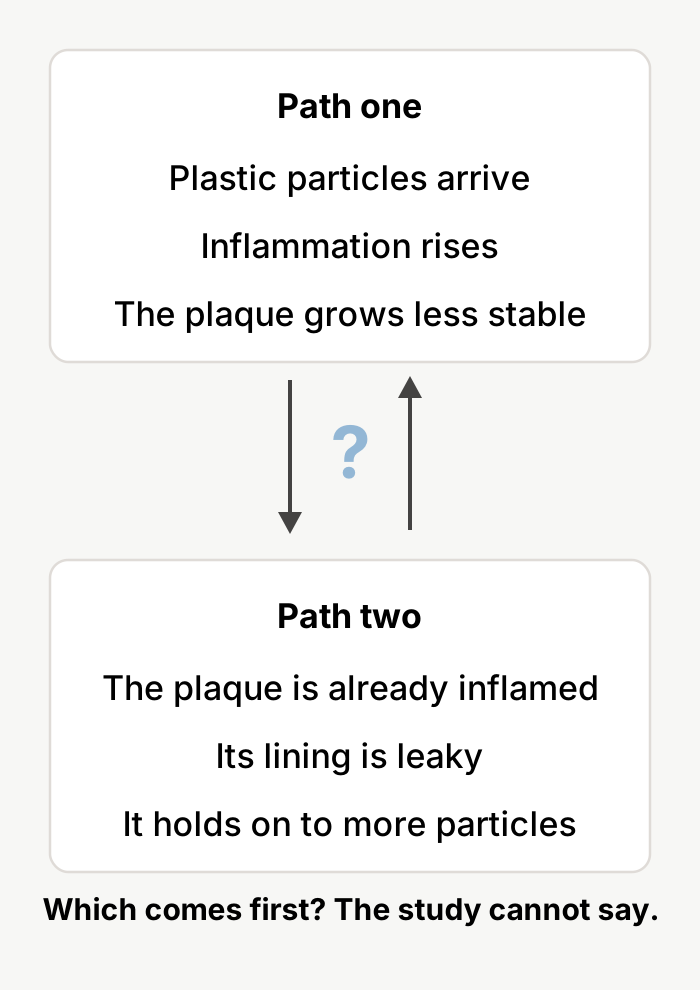
A pair in Shanghai turned the arrow around: inflamed tissue packed with immune cells may simply take up more particles. The authors agreed they cannot rule that out.[6, 10, 12]
Two more letters asked about things the study never measured. One pointed out that plastic particles can carry other pollutants on their surface, so what travels with them may matter too. The other asked whether the fluid from a hospital IV drip could be one way plastic gets into the blood. The authors replied that neither was covered in their study.[6, 9, 11, 12]
What that does to the tissue
Samples with a plastic signal carried more inflammation markers, more immune cells, and less collagen than samples without one.[1, 2]
Each of those matters. Plaque starts as a small deposit of fat inside the wall of an artery. Inflammation is what turns that deposit into a plaque that can rupture. It drives every stage, from the first deposit to the clot that causes a heart attack.[14]
The immune cells are the same ones that swallowed the particles. They are the engine of that inflammation. They fill up with fat, they die, and they leave behind a soft core that can split open.[15]
Collagen is the tough outer cap that holds the plaque shut. Those same immune cells give off chemicals that eat through it. A thin cap is the kind that splits.[16, 17]
More inflammation, more immune cells, less collagen. That is a plaque in worse shape, and it is what the plastic group carried.[1, 2]
What this proves, and what it doesn't
What this study supports
What this study did not prove
Questions readers are asking
How many patients in this study had plastic detected in their artery plaque?
Plastic showed up in 150 of the 257 samples. Only two kinds appeared. Polyethylene was in all 150. PVC was in 31, and never on its own. The other nine kinds on the test list never showed up.[1, 2]
What share of patients with detected plastic later had a heart attack, stroke, or died, compared with those without it?
About 1 in 5 of the group with plastic, and about 1 in 13 of the group without. In whole people, that is 30 of 150 against 8 of 107.[1, 2]
Does this study show that plastic in plaque leads to heart attacks or strokes?
No. It found that the two groups were different. It did not find out why. The authors say so in the paper itself.[1]
Could the plastic found in the plaque have come from contamination during surgery or in the lab, rather than from the patient?
The authors say they cannot rule it out. Two doctors pointed out that no blank sample was ever taken from the operating room, where the same two plastics are everywhere. A plastic-free clean room would settle it.[1, 6, 7]
About Aelo
Lab-tested on particles down to 0.5 microns (500 nanometers). Aelo's products are not connected to this research.
A conceptual hero image in the Aelo palette. A single translucent shard of ordinary plastic floats slightly off-center against a graded blue-green background, with no text, no anatomy, no tissue and no data. It carries no scientific result and depicts no specimen from this or any study.
A conceptual illustration in the style of a colorized scanning electron micrograph. One immune cell fills the frame; angular plastic fragments, tinted pale blue so they read as foreign, sit embedded in its surface with smaller chips scattered across it. The fragments are drawn far larger than the particles the study describes, for visibility. No scale, no data, and no specimen from this or any study is depicted.
Two vertical bars compare the share of patients reaching the composite of nonfatal myocardial infarction, nonfatal stroke or death from any cause over a mean 33.7 months of follow-up. The axis starts at zero and is not truncated. Each bar is labelled with its percentage and with its numerator and denominator in whole patients. A secondary annotation band carries both hazard ratios with their intervals and the total of 38 composite events across both groups, alongside a note that association is not causation and that the crude ratio of the two shares (about 2.7) is a proportion ratio rather than a reported effect estimate.
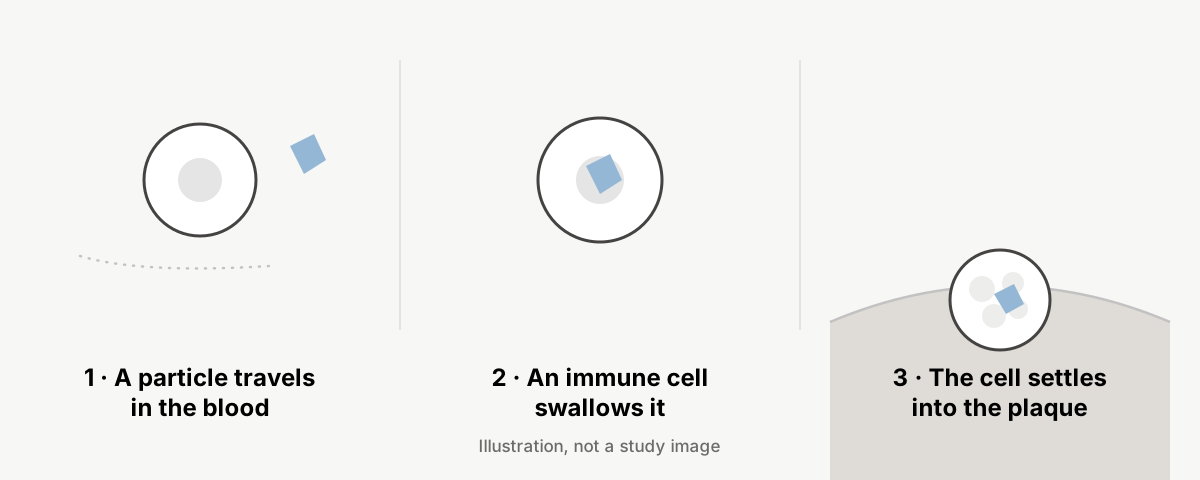
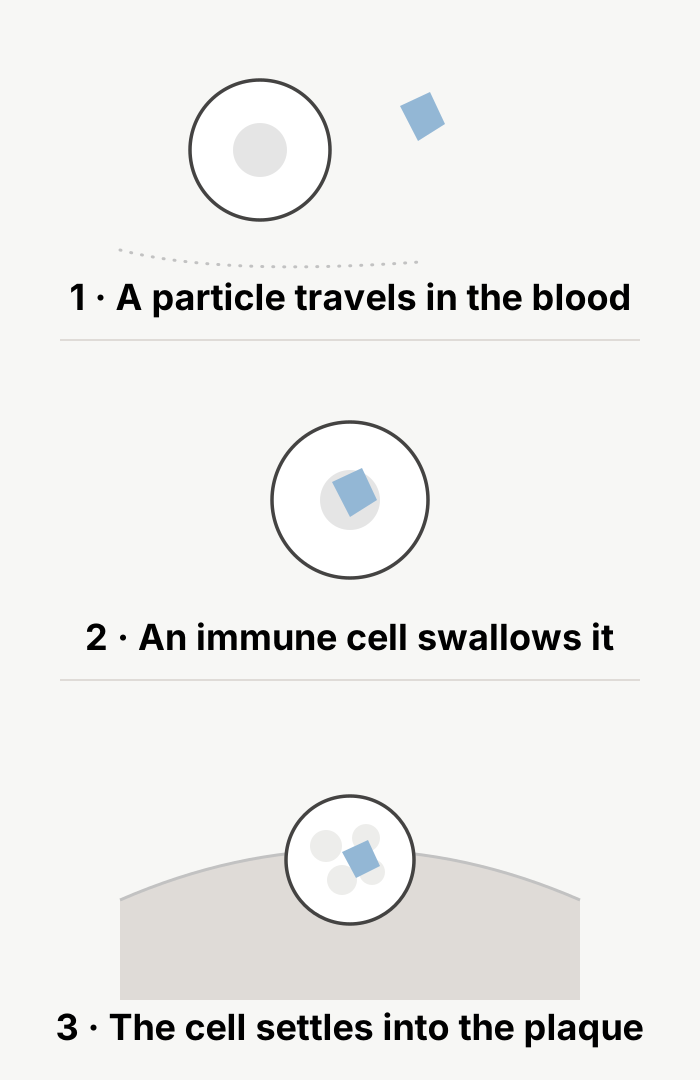
An abstract editorial illustration under visual-truth order VTA-001. Rounded translucent forms suggest immune cells; a scatter of small angular flecks sits among and within them. Nothing is drawn to scale, no anatomy is depicted, and no measurement from this or any study is represented. It loosely evokes the idea of particles travelling with the cells that clear them and must not be read as evidence.
An abstract, non-clinical editorial illustration under visual-truth order VTA-001. A single line forks into two arrows of equal weight pointing in opposite directions, standing for the two readings raised in the published correspondence and conceded in the authors' reply: particles may inflame tissue, or inflamed tissue may take up more particles. It depicts an open question, not a mechanism, and carries no study result.
A top-to-bottom flow diagram of the study's recruitment funnel, drawn only from claim-ledger values; the sourceIds record which sources those values came from, and no element of any source figure's layout was used in constructing it. Each stage box carries its count and each side branch carries the reason for leaving. A footer band states the design: patients were grouped after their excised plaque was analyzed, with no randomization and no assigned exposure. A caption band records that the article gives two readings of when the 8 in-hospital stroke and death cases were excluded, giving post-enrollment attrition of either 47 of 304 (15.5%) or 55 of 312 (17.6%), and that this diagram does not resolve the discrepancy.
The technical record
Everything above is the story. Everything below is the paperwork: the exact statistics as published, the study’s own fine print, and the parts only a methods reviewer will want.
The numbers, exactly as published
| The comparison that made headlines | 20.0% (30 of 150) versus 7.5% (8 of 107); adjusted hazard ratio 4.53 (95% CI 2.00 to 10.27; P < 0.001), from a Cox model carrying the exposure term plus 11 covariates. |
|---|---|
| Why the number went up, not down | Unadjusted hazard ratio 2.84 (95% CI 1.50 to 5.40; P = 0.007); adjusted hazard ratio 4.53 (95% CI 2.00 to 10.27). The crude ratio of the two observed shares (20.0% divided by 7.5%) is about 2.7 and is a proportion ratio, not a time-to-event estimate. |
Technical detail: How did they find plastic inside an artery?
Technical detail: the paper reports the PVC count as "31 of those (12.1%)", and that phrasing is internally ambiguous. Thirty-one of the 150 polyethylene-positive plaques is 20.7%, while 31 of the 257 analysed plaques is 12.1%. The printed percentage matches the larger denominator, so this review reports 31 of 257 and records the ambiguity rather than resolving it.[1, 2]
Technical detail: the method is pyrolysis-gas chromatography-mass spectrometry, run on 1 mg of freeze-dried plaque against an 11-polymer calibration standard. Limits of detection span three orders of magnitude, from 0.12 ng for polymethyl methacrylate to 3.86 ng for polyvinyl chloride to 168.17 ng for polyethylene. Group assignment used the detection threshold rather than the higher quantification threshold, so a sample could count as positive without a reliable amount attached to it.[1, 2]
Technical detail: the ClinicalTrials.gov record (NCT05900947) was first submitted on 28 April 2023 and first posted on 13 June 2023, nearly three years after recruitment closed in July 2020. As first posted it declared an actual start of 1 January 2023 and a status of recruiting; the start date was later revised backward by more than three years to 1 September 2019. No field in that record can be read as a plan set before the data were collected.[3, 4, 5]
Did detection differ by hospital or by where patients lived?
How often plastic was detected looked much the same at all three hospitals and across all five residential areas. That does not mean exposure is even across a population. It means this study could not see a difference, in groups as small as 16 people.[2]
The 257 people kept in the count and the 47 dropped for missing data or lost contact looked alike on the traits that were written down, including how often plastic was found. No test was run on that comparison, and no check was done to see how the dropped patients would move the main figure.[2]
And nine of the eleven plastics were never seen in any sample. Not seen is not the same as not there. Below each plastic's own floor, the machine reports nothing at all.[1, 2]
How did 447 people become 257?[1, 3, 4, 5]
See the exact data behind this chart
| Measure | Value |
|---|---|
| In plain words | Of 447 patients approached, 312 agreed to screening, 8 left the study after an in-hospital stroke or death, 304 remained, and 47 were dropped for incomplete data or loss to follow-up, leaving 257 in the analysis. The article is internally inconsistent about when those 8 departed: the flow diagram places them before enrollment, while the Methods exclude patients whose complications occurred in the postoperative period before discharge. |
| Result | 447 approached, 312 screened, 8 removed after in-hospital stroke (6) or death (2), 304 enrolled per the flow diagram, 47 excluded (26 incomplete data, 21 lost to follow-up), 257 analyzed and split 150 with and 107 without a detected signal. Attrition after enrollment is 47 of 304 (15.5%) on the flow-diagram reading and 55 of 312 (17.6%) on the Methods reading, which places the 8 in-hospital events after eligibility and after endarterectomy. |
| People with this result | 257 |
| People counted | 304 |
| In plain words | The trial record was first submitted to ClinicalTrials.gov on April 28, 2023 and first posted on June 13, 2023, nearly three years after recruitment closed in July 2020, and the record as first posted declared a study that had not yet begun recruiting patients in 2019 at all: its stated start date was January 1, 2023, later revised backward to September 1, 2019. |
| Result | Current registry: study first submitted 2023-04-28, first submitted QC 2023-06-12, first posted 2023-06-13, ACTUAL start 2019-09-01, ACTUAL primary completion 2023-07-30, overall status COMPLETED. Record as first posted (version 0, 2023-06-12): overall status RECRUITING, ACTUAL start 2023-01-01, estimated primary completion 2024-01-30. Article: consecutive patients recruited August 1, 2019 to July 31, 2020, followed to July 1, 2023. |
The fine print
The whole comparison rests on 38 results in total, 30 in one group and 8 in the other. Those 38 were fed into a model estimating twelve things at once, roughly three results per estimate. That is why the range around the adjusted figure runs from about 2 to about 10.[1, 2]
The study also came out smaller than it planned for. When the sample size was worked out, the researchers assumed 9 results per 100 person-years in the group without plastic. The published figure was 2.2, about a quarter of that.[1, 2]
Technical detail: the published rates and the published follow-up time do not reconcile. Thirty results at 6.1 per 100 patient-years implies about 492 patient-years, or 39.4 months per patient; 8 at 2.2 per 100 patient-years implies about 364 patient-years, or 40.8 months per patient. Both exceed the reported mean follow-up of 33.7 plus or minus 6.9 months, and stopping the clock at each result would shorten person-time rather than lengthen it.[1, 2, 3]
Quote both rates as published figures, not as checked quantities.[1, 2, 3]
Technical detail: the inflammation markers, immune-cell staining and collagen content were measured on the same specimen at the same moment as the plastics signal, with no P values, effect sizes or multiplicity adjustment reported across the seven comparisons; the data cannot order which came first.[1, 2]
Technical detail: the composite is reported by component only as raw counts. Signal group: 14 strokes, 10 myocardial infarctions, 6 deaths (30). No-signal group: 5, 2, 1 (8). No per-component effect estimate, interval or P value is reported, and all-cause death is included without competing-risk handling, so no component can be claimed on its own.[2]
Technical detail: a second model treated the measured plastic amount as a continuous variable and reported a hazard ratio of 1.04 (95% CI 1.03 to 1.04) per unit, but the unit is never defined in the table, its legend, or the main text, and the interval is implausibly narrow for 38 events. The figure cannot be quoted.[2]
Technical detail: the electron-microscopy subsample was ten patients already positive for both polymers, so it corroborates rather than independently checks the detection; the authors cannot firmly rule out laboratory contamination; and no source of the detected material was identified, with device coatings raised as one possibility in correspondence.[1, 6, 8, 12]
What the public record says
The public record does not match the published paper. The registry names a different set of things to adjust for and sets a 24-month window against the 33.7 months reported. Its stated target also moved, from 145 patients to 300 consecutive patients, after the study had been marked complete.[1, 3, 4, 5]
A separate registry field, enrollment, was set to 312 actual, which is the number screened rather than the 257 counted in the analysis.[1, 3, 4, 5]
Several things the registry promised never appear in the paper at all: a split of the results into thirds by pollutant load, four proteins measured by Western blot, a lab method for measuring specific proteins, and a panel of volatile organic compounds, meaning chemicals that evaporate into the air. Two things that do appear, interleukin-18 and CD3, were never registered, and the cytokine work was done on a different platform from the one listed.[2, 3]
Eight patients had a stroke or died in the hospital and were taken out of the count. Their buildup had already been removed and could have been tested, yet no plastic result is reported for any of them. The paper places that removal at two different points in the process and never settles which is right.[1]
Two loose ends, and one of ours
Two loose ends. The stated age limit was 75, but the tables reach 77. And one appendix panel prints a rising equation beneath a falling line for collagen, so that slope cannot be quoted either way.[1, 2, 3]
One last limit belongs to this review, not the study. For a few details taken from the paper's appendix and from the published letters, we checked the numbers against each other and against the publication records, rather than reading those pages ourselves. We flag them here so you know how far our own checking went.[2, 3, 6, 7]
Nobody outside the team can currently recheck any of this. The journal's data-sharing form answers yes to releasing the full de-identified data set but leaves the how, the who and the when blank, and the registry lists data sharing as undecided. Releasing that data set is what would let anyone check every figure here.[3, 13]
Sources
- Marfella R, Prattichizzo F, Rajagopalan S, et al. Microplastics and nanoplastics in atheromas and cardiovascular events. N Engl J Med. 2024. doi:10.1056/NEJMoa2309822. PMID 38446676. Microplastics and Nanoplastics in Atheromas and Cardiovascular Events
- Supplementary Appendix to Marfella R, et al. Microplastics and nanoplastics in atheromas and cardiovascular events. N Engl J Med. 2024. Tables S1-S5, Figures S1-S6, and Supplementary Methods. Supplementary Appendix: Microplastics and Nanoplastics in Atheromas and Cardiovascular Events
- ClinicalTrials.gov. Atherosclerotic Plaque and Chemical Environmental Pollutants (APAChE), NCT05900947. Current record: status, design, outcomes, eligibility and IPD-sharing modules. NCT05900947 (APAChE), current ClinicalTrials.gov record
- ClinicalTrials.gov. NCT05900947, record as first posted (version 0, 12 June 2023): overall status RECRUITING, actual start 2023-01-01, estimated primary completion 2024-01-30, estimated enrollment 145. NCT05900947, record as first posted (version 0)
- ClinicalTrials.gov. NCT05900947, record version history: Study Status and Study Design edits at versions 1 and 2, enrollment changed from 145 estimated to 312 actual. NCT05900947, ClinicalTrials.gov record version history
- Correspondence and authors' reply: Microplastics and nanoplastics in atheromas and cardiovascular events. N Engl J Med. 2024;390(18):1726-1728. doi:10.1056/NEJMc2404154. Microplastics and Nanoplastics in Atheromas and Cardiovascular Events (correspondence and reply)
- Holda MK, Batko J. Microplastics and nanoplastics in atheromas and cardiovascular events. N Engl J Med. 2024;390(18):1726. doi:10.1056/NEJMc2404154. PMID 38718363. Letter: contamination risk in the detection of plaque micro- and nanoplastics
- Kalkman, Renkens, Grundeken. Microplastics and nanoplastics in atheromas and cardiovascular events. N Engl J Med. 2024;390(18):1726. doi:10.1056/NEJMc2404154. PMID 38718364. Letter: hydrophilic polymer coatings from endovascular devices as an alternative source
- Ghirga G, Ghirga P, Orchi C. Microplastics and nanoplastics in atheromas and cardiovascular events. N Engl J Med. 2024;390(18):1726-1727. doi:10.1056/NEJMc2404154. PMID 38718365. Letter: chemicals adsorbed onto plastic particles and geographic variation in risk
- Wang X, Tian S. Microplastics and nanoplastics in atheromas and cardiovascular events. N Engl J Med. 2024;390(18):1727. doi:10.1056/NEJMc2404154. PMID 38718366. Letter: particles as a marker of macrophage infiltration rather than a driver
- Glazier HA. Microplastics and nanoplastics in atheromas and cardiovascular events. N Engl J Med. 2024;390(18):1727. doi:10.1056/NEJMc2404154. PMID 38718367. Letter: intravenous fluids as an unassessed route of exposure
- The Authors Reply. Microplastics and nanoplastics in atheromas and cardiovascular events. N Engl J Med. 2024;390(18):1728. doi:10.1056/NEJMc2404154. PMID 38718368. The Authors Reply
- Data Sharing Statement for Marfella R, et al. Microplastics and nanoplastics in atheromas and cardiovascular events. N Engl J Med. Posted 7 March 2024. NEJM Data Sharing Statement
- Libby P. Inflammation in atherosclerosis. Nature. 2002;420(6917):868-874. doi:10.1038/nature01323. PMID 12490960. Background review, not a source for this study's findings. Inflammation in atherosclerosis
- Moore KJ, Tabas I. Macrophages in the pathogenesis of atherosclerosis. Cell. 2011;145(3):341-355. doi:10.1016/j.cell.2011.04.005. PMID 21529710. Background review, not a source for this study's findings. Macrophages in the pathogenesis of atherosclerosis
- Shah PK, Falk E, Badimon JJ, et al. Human monocyte-derived macrophages induce collagen breakdown in fibrous caps of atherosclerotic plaques. Circulation. 1995;92(6):1565-1569. PMID 7664441. Background study, not a source for this study's findings. Human monocyte-derived macrophages induce collagen breakdown in fibrous caps of atherosclerotic plaques
- Libby P. Collagenases and cracks in the plaque. J Clin Invest. 2013;123(8):3201-3203. doi:10.1172/JCI67526. PMID 23908120. Background commentary, not a source for this study's findings. Collagenases and cracks in the plaque