Microplastics are making mice fat. What about humans?
A Kentucky lab put microplastics in the drinking water of male mice. At the higher dose, they gained extra weight within 3 weeks. They were still ahead at week 12. In 2024 the same lab ran the test again. Mice on the smaller particles gained extra weight again, mostly fat.
6 minute read · Updated · By Aelo Research

Short Summary
Scientists at the University of Louisville in Kentucky put microplastics in the drinking water of male mice. In 2022, they ran the test for 12 weeks while other mice drank clean water. At the higher dose, the mice gained extra weight within 3 weeks. They were still ahead at week 12. A body scan at week 9 found more fat in 3 of the 4 plastic groups. In 2024, the lab ran the test again and saw the same result for the smaller particles. The extra weight was mostly fat. Those mice's livers also held 24% more cholesterol. The bottom line: in this lab, microplastics in drinking water made male mice gain extra weight and fat, twice. That's the problem: microplastics have reached water supplies, and no one has run this test in people.[1, 2]
Do animal studies matter for humans?
Yes. These male mice took in microplastics one way people do: in the water they drank each day. Mice and people share the same guard posts in the gut wall, which pull in tiny swallowed bits. In people, a 2024 snapshot of 121 young adults linked more plastic in stool with more weight for height. The mice showed where to look, and that study in people points the same way.[1, 2, 9, 13]
Read our full article: Do animal studies matter for humans?
At a glance: both studies
Do microplastics cause weight gain in mice?
Ahead on weight by week 3
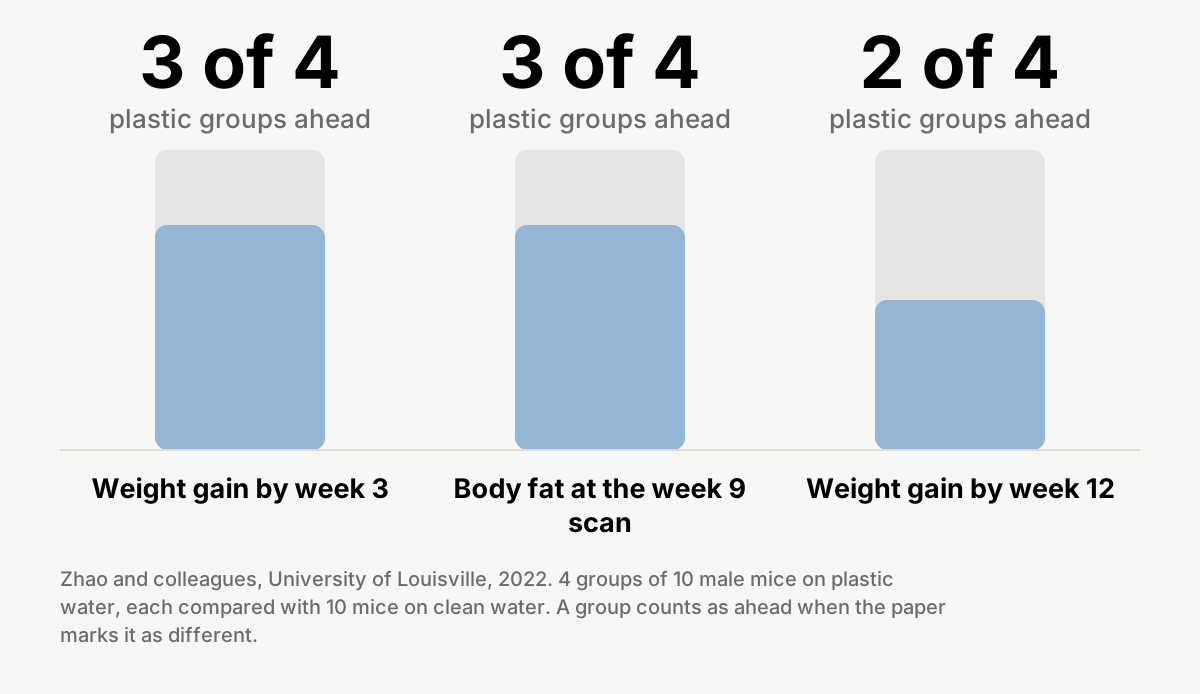
In this lab, yes. In 2022, 4 groups of 10 male mice drank plastic particles in their water. Each group got 1 of 2 particle sizes, at 1 of 2 amounts. Another 10 mice drank clean water. By week 3, mice in 3 of the 4 plastic groups had gained more weight. At weeks 9 and 12, both groups on the higher amount were still ahead.[1]
More body fat at the week-9 scan
A body scan at week 9 found more fat in 3 of the 4 plastic groups. A 24-hour test checked the mice on small particles at the higher amount. They did not eat more or move less than mice on clean water.[1]
Higher blood sugar and insulin
The mice on small particles at the higher amount showed the most changes in their blood. After a fast, their blood sugar was higher at week 12. Their insulin after a fast was higher too. Insulin is the hormone that moves sugar out of the blood.[1]
How many plastic groups pulled ahead?[1]
Did it happen again in 2024?
Extra weight again, mostly fat
The same lab ran the test again with new mice, for 13 weeks. Both plastic groups got the higher amount. The mice on the smaller particles gained more weight than mice on clean water. Most of the extra weight was fat. This time, the larger particles did not add extra weight. In the small-particle mice, the belly fat held more of one kind of immune cell.[2]
More cholesterol stored in the liver
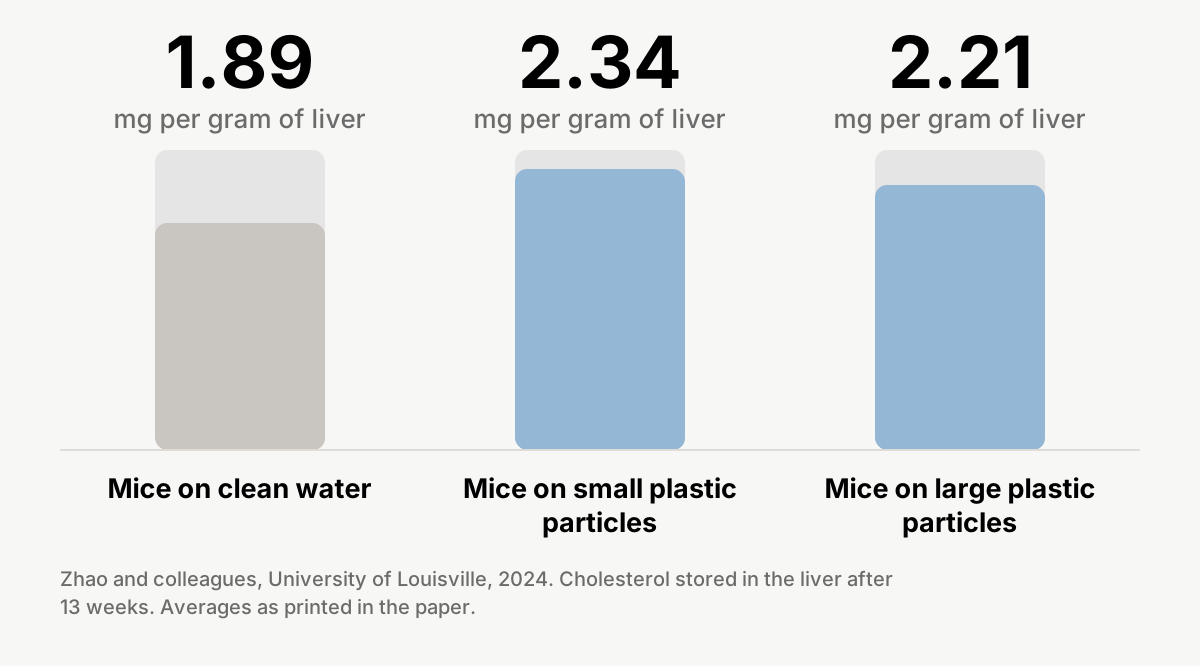
Mice in both plastic groups stored more cholesterol in their livers than mice on clean water. On the small particles, it was 24% more. Under the microscope, the livers looked healthy. Inside the small-particle livers, though, 283 genes had switched up or down.[2]
How much cholesterol did the mice's livers hold?[2]
How much plastic did the mice drink?
The plastic was polystyrene, the plastic in foam cups. The particles came in 2 sizes: 0.5 and 5 thousandths of a millimeter wide. In 2022, the water held 0.1 or 1 milligram of particles per liter. In the repeat, both plastic groups got the higher amount. At that amount, each milliliter of small-particle water held more than 100,000 particles.[1, 2]
The mice drank it when they liked, day and night. Each mouse drank about 3 to 5 milliliters a day. The other mice drank the same water, without plastic. So the plastic was the only change between the groups.[1, 2]
Microplastics have found their way into water supplies and the food chain, the team notes.[2]
Why run it twice?
One result on its own can be a fluke. A few odd cages can push a number around. The way to check is to run the whole thing again.
So the team did, with new mice and a longer run. The extra weight came back on the smaller particles. Their second paper says these particles can be classed as fat-promoting, based on the mice.[2]
Other labs have seen mice gain weight on plastic too. In Beijing, mice on a fairly low amount became overweight. A second Beijing team fed mice a high-fat diet. Those with plastic in their water gained more weight.[3, 4]
How do microplastics make mice gain weight?
The team's answer starts in the gut. In the first study, small particles at the higher amount changed the mice's gut bacteria. Other studies link that kind of shift to obesity.[1]
In the repeat, the team followed the trail to the liver. The liver makes digestive juices, called bile acids, from cholesterol. The plastic changed their mix.[2]
Their idea is a chain. Plastic changes the gut. The gut sends different signals to the liver. Then the liver and the body fat respond.[2]
That second Beijing team also tested the gut link, in mice on a high-fat diet. When antibiotics wiped out their gut bacteria, the plastic no longer added weight.[4]
What this proves, and what it doesn't
What these studies show
What these studies did not prove
- That the same happens in people. Studies in people so far show a link, not a cause, and mixed results.[9, 10, 11]
- One lab ran both studies. The repeat held for the smaller particles only, and it is not an outside check.
- Not every plastic group gained. The lower amount in 2022 did not add weight by the end. Nor did the large particles in 2024.[1, 2]
- Other labs saw other results. On the same amount, Kyoto mice weighed about the same after 4 and 6 weeks. They were fed equal portions. Hangzhou mice weighed less after 5 weeks. In Beijing, mice on a normal diet gained about the same with or without plastic. In a 2023 study, mice on high amounts lost weight.[3, 4, 5, 6, 7, 8]
- The particles were new lab particles, not worn plastic. Why the mice gained is still not clear.[2]
Questions readers are asking
Can microplastics cause weight gain?
In male mice, yes. In 2 studies at one lab, mice that drank plastic particles gained extra weight. In people, studies so far show a link, not a cause. A 2024 snapshot of 121 young adults found one. More plastic in stool went with more weight for height.[1, 2, 9]
Is that more plastic than people take in?
The team checked its doses against estimates for people. In 2022, it looked at 12 weeks of small particles at the higher amount. It said that sat at the high end of those estimates. In 2024, it called its amount within their range. Aelo does not turn a mouse dose into a human one.[1, 2]
Did the mice just eat more?
Not in the test the team ran. In 2022, mice on small particles at the higher amount spent 24 hours in a test chamber. They did not eat more, drink more or move less than mice on clean water.[1]
Did every mouse study find weight gain?
No. In a 2023 study, mice on a fairly low amount of plastic got heavier. Mice on much higher amounts lost weight. In Kyoto, mice on the Louisville amount weighed about the same after 4 and 6 weeks. They were fed equal portions. In Hangzhou, mice on that amount weighed less after 5 weeks.[3, 5, 6, 7]
Do berries protect against microplastics?
That was not tested. In 2024, 8 mice on plastic water got shots of delphinidin, a pigment found in berries. The shots came twice a week for 4 weeks. Those mice gained less weight than 8 mice given a dummy shot. No mouse ate any berries.[2]
About Aelo
Lab-tested on particles down to 0.5 microns (500 nanometers). Aelo's products are not connected to this research.
The technical record
Everything above is the story. Everything below is the paperwork: the exact statistics as published, the study’s own fine print, and the parts only a methods reviewer will want.
The numbers, exactly as published
| Ahead on weight by week 3 | Groups 3, 4 and 5 above control at week 3; groups 3 and 5 at weeks 9 and 12 (p < 0.05 marks; weights shown only as charts). |
|---|---|
| More body fat at the week-9 scan | DEXA at week 9 only: groups 3, 4 and 5 above control (p < 0.05). Metabolic chamber, group 5 against control: no significant difference. |
| Higher blood sugar and insulin | Group 5: fasting glucose (week 12), fasting insulin and HOMA-IR above control (p < 0.05). Glucose and insulin tolerance tests: no difference. |
| Extra weight again, mostly fat | 0.5 µm: "potentiated" weight gain, values in Suppl. Fig 1 only; 5 µm: no significant extra gain. F4/80+ macrophages up in belly fat with 0.5 µm (p < .05; n = 8 to 10). |
| More cholesterol stored in the liver | Cholesterol (mean ± SD, mg/g): 1.89 ± 0.16; 2.34 ± 0.33 (p = .005); 2.21 ± 0.15 (p = .0006). Genes changed: 283 with 0.5 µm, 49 with 5 µm (q < 0.05). |
The fine print: the 2022 study, group by group
The 5 groups: group 1, clean water; group 2, 5 µm particles at 0.1 µg/ml; group 3, 5 µm at 1.0 µg/ml; group 4, 0.5 µm at 0.1 µg/ml; group 5, 0.5 µm at 1.0 µg/ml. Each was 2 cages of 5 male C57BL/6 mice (n = 10), 12 weeks old on purchase, with 1 week to settle. The authors estimated intake at 0.36 or 3.6 µg of particles a day, assuming 3.6 ml of water a day from metabolic-cage data. For the 0.5 µm particles at 1.0 µg/ml they state more than 100,000 particles per ml.[1]
Weight: groups 3, 4 and 5 gained more than control at week 3; groups 3 and 5 at weeks 9 and 12; Figure 2A also marks group 3 at week 6. Groups 2 and 4 did not differ from control at week 12. Body fat was scanned once, at week 9: groups 3, 4 and 5 higher. The abstract says the weight gain came "with a corresponding increase in body fat" as early as 3 weeks; fat was not scanned at week 3.[1]
Eating and moving: in a 24-hour metabolic chamber, group 5 against control, dark phase (6 PM to 6 AM), mean (SE): food 76.1 (6.8) against 90.3 (2.8) g/kg; water 90.8 (8.9) against 107.9 (4.7) ml/kg; total activity 698.3 (42.4) against 677.0 (38.4). None of these differed significantly.[1]
Blood sugar: groups 2, 4 and 5 higher at week 3; only group 5 at week 12; the paper notes levels "varied and actually decreased" in later weeks, controls included. Glucose tolerance test (all groups, week 9) and insulin tolerance test (group 5 against control): no differences. Fasting insulin and HOMA-IR, a standard score for insulin resistance (when the body stops responding well to insulin): group 5 higher. Gut bacteria, group 5 against control, 20 stool samples at 12 weeks: lower beta diversity (PERMANOVA q = 0.028) and a relative rise of Firmicutes over Bacteroidetes; the authors note that other studies link a higher Firmicutes to Bacteroidetes ratio to obesity in mice and in people. The insulin chart's axis reads µg/ml, which is almost certainly a labeling error, so no insulin value is given here.[1]
Blood fats: total cholesterol, LDL and triglycerides did not change; HDL rose in group 5 only, 43.7 (SE 2.0) against 35.7 (SE 2.2) mg/dL. Blood cells: eosinophils and basophils rose with the 5 µm particles only. Aorta, tested outside the body with the 0.5 µm groups combined: 1.75-fold more sensitive to phenylephrine (EC50 61.6 ± 10.7 against 35.2 ± 5.5 nM; n = 5 against 10), which the authors call a mild sensitization, with no clear loss of function in the vessel lining.[1]
Fat around blood vessels, group 5 against control, 4 mice each, pooled RNA array: 5 genes up at least 1.5-fold and 14 down, with Dkk1 up 4.234-fold and Gata3 down to 0.051. The follow-up tests on single samples carry no p-values in Table 2. The authors read the pattern as consistent with more fat-cell formation and a shift toward storage fat.[1]
The fine print: the 2024 study, measure by measure
Main experiment: 3 groups of 10 male C57BL/6 mice (2 cages of 5), 12 weeks old on purchase, 1 week to settle, then clean water or 0.5 µm or 5 µm particles at 1.0 µg/ml for 13 weeks; water intake 3 to 5 ml a day per mouse.[2]
Weight: the Results report a "potentiated weight gain" with the 0.5 µm particles after 13 weeks, "primarily due to adipose tissue expansion", say the main 2022 weight result was "repeated in the current treatment", and state that the 5 µm particles did not produce a significant extra gain. The Abstract says the plastic-water mice gained extra weight without naming a size; this article follows the Results. The weights are only in Supplementary Figure 1.[2]
Fat tissue: F4/80-positive macrophages rose in epididymal fat with 0.5 µm particles (p < .05; n = 8 to 10), not with 5 µm; the M1 rise was not significant (p = .06); M2 macrophages and T cells did not differ; adiponectin, resistin, leptin and PAI-1 did not differ (n = 10); fat genes showed minor changes in belly fat and a mild rise of Mcp-1 and TNFα in fat around vessels (Table 1, no p-values). The authors conclude the fat "did not appear to be dysfunctional" at this time point.[2]
Liver: normal on the microscope slide, no fat droplets or inflammation; liver weight as a share of body weight fell, from 5.01 ± 0.29% to 4.56 ± 0.22% (0.5 µm, p = .0165) and 4.33 ± 0.50% (5 µm, p = .0005); triglycerides unchanged; cholesterol rose, from 1.89 to 2.34 mg/g (0.5 µm) and 2.21 mg/g (5 µm): 24% more with the small particles (2.34 ÷ 1.89 = 1.238, rounded to 24%) and 17% more with the large particles (2.21 ÷ 1.89 = 1.169), our arithmetic from the paper's printed averages; ALT and AST unchanged; glutathione unchanged. Liver genes changed (q < 0.05, n = 10): 283 with 0.5 µm (203 up, 80 down) and 49 with 5 µm (41 up, 8 down), 5 shared. Pathway analysis flagged "FXR/RXR activation" and "LXR/RXR activation" with both sizes.[2]
Bile acids: in the liver, 0.5 µm particles lowered TCDCA (0.57-fold, p = .02) and THDCA (0.33-fold, p < .05); 5 µm particles raised HDCA (1.93-fold, p = .0002) and THCA (2.02-fold, p = .03). In the cecum, 0.5 µm particles raised apocholic acid (2.17-fold, p = .005); 5 µm particles raised UDCA (1.87-fold, p = .03) and γ-muricholic acid (3.11-fold, p = .03).[2]
Delphinidin test: delphinidin chloride, a natural pigment found in berries, 20 mg/kg, injected into the belly cavity twice a week for 4 weeks, in mice on 0.5 µm particle water; clean water with no injection (n = 4), particles plus dummy injection (n = 8), particles plus delphinidin (n = 8). The delphinidin mice gained less weight and carried less body fat than the dummy-injection mice. The text gives no values. Figure 4 marks delphinidin against the dummy shot for weight and fat, and delphinidin against clean water for weight. It shows no mark between clean water and particles plus dummy shot in this 4-week test, so it does not show plastic weight gain on its own. Nothing was given in food or drink. The small intestine showed no damage or inflammation.[2]
The fine print: how the tests were run
Both studies started the same way. The team bought male mice that were 12 weeks old and gave them a week to settle in. Then it picked cages at random: 2 cages of 5 mice for each group.[1, 2]
The particles came from a lab supplier (Creative Diagnostics), new and clean. Before each batch of water, the team shook the particle stock with sound waves for 30 minutes to break up clumps. It made fresh particle water every other day, and on the days in between it shook the bottles so the particles would not settle. The clean-water mice drank filtered, sterilized water.[1, 2]
Every 3 weeks, each mouse went on the scale. In 2022 the team also checked fasting blood sugar every 3 weeks, scanned body fat at week 9 and collected stool to read the gut bacteria. In 2024 the fat scan came every 3 weeks, and at the end the team collected blood, belly fat, fat around blood vessels, liver, cecum and small intestine. Neither paper says whether the researchers knew which group each mouse was in.[1, 2]
The fine print: the gut, liver and fat chain
Zhao 2024 names its proposal in its title: a disrupted gut-liver-adipose axis. It reports enrichment of "FXR/RXR activation" and "LXR/RXR activation" in the liver with both particle sizes, and states that "The mechanism(s) driving the increased weight gain and adiposity in PS-fed mice remain unclear." It found no drop in beta-catenin and reads that as a sign that disrupted Wnt signaling is not a major cause. It names gut bacteria and their products as another candidate, which it says needs more study. Gut bacteria were measured in 2022, not in 2024.[2]
The Beijing test of the gut link (Zhai 2024, China Agricultural University) used male mice on a high-fat diet with 5 µm polystyrene at 10 mg/L in their water. When antibiotics wiped out their gut bacteria, the plastic no longer made a difference to weight. Then the team moved stool from high-fat plastic mice into high-fat-fed mice whose own gut bacteria had been cleared with antibiotics; those mice put on more weight than mice given stool from high-fat mice on clean water. On a normal diet, plastic made no difference to weight gain.[4]
The fine print: what we did not print, and why
The 2022 paper prints no weights, body-fat shares, blood-sugar or insulin values as numbers. They appear only as charts. This article prints no value read off a chart.[1]
The 2024 paper's 13-week weight numbers are in Supplementary Figure 1, part of a supplementary data file on the journal and PubMed Central pages. Our automated download met a bot check, which we did not try to get around, so no 2024 weight number appears here.[2]
The 2024 paper's funding note reads "does represent official views" of the National Institutes of Health, where "does not" was almost certainly meant.[2]
Dose, in the researchers' own words: in 2022 the most effective dose and particle size (0.5 µm particles at 1.0 µg/ml), over 12 weeks, "would be at the higher end of estimated human consumption"; in 2024 the dose is "in a range of estimated human exposures", citing two published estimates. This article does not convert a mouse dose into a human one.[1, 2]
The fine print: the wider evidence in full
Huang 2023 (Tsinghua and Peking universities; abstract only, paywalled): mice on high concentrations lost significant weight, the lowest concentration showed little change, and relatively low concentrations made mice overweight, with more fat, a better appetite and lower activity. The abstract gives no doses, particle size, route, strain, sex, group sizes or length. Zhao 2024 cites Huang 2023 twice, for the weight gain and for gut bacteria, and not for the weight loss.[2, 3]
Lu 2018 (Zhejiang University of Technology, Hangzhou; abstract only, paywalled): male mice exposed by mouth to 0.5 and 50 µm polystyrene for 5 weeks; at 1,000 µg/L (the same as 1 µg/ml) both sizes lowered body, liver and fat weight, and lowered liver triglycerides and liver cholesterol. The route (drinking water) and the number of mice (40 in all) come from the Chartres 2024 review's table.[5, 8]
Okamura 2023 and Hasegawa 2024 (one research group, Kyoto Prefectural University of Medicine; full text): male C57BL/6J mice, 0.45 to 0.53 µm polystyrene in water at 1,000 µg/L for 4 weeks (normal or high-fat diet), and at 1,000 or 5,000 µg/L for 6 weeks (normal diet); no body-weight difference. In both studies each mouse got an equal portion of food (in 2023, of water too), which can hide a gain that comes from eating more.[6, 7]
Zhai 2024 (China Agricultural University, Beijing; full text): male C57BL/6J mice, 6 per group, 5 µm polystyrene at 10 mg/L in drinking water for 8 weeks. On a normal diet, weight gain was similar with and without plastic. On a high-fat diet, body weight reached 175.21% ± 5.35 of the starting weight with plastic against 158.17% ± 8.25 without. Wiping out the gut bacteria removed the difference, and moving stool from high-fat plastic mice into high-fat-fed mice whose gut bacteria had been cleared with antibiotics carried the weight gain over.[4]
People: Hong 2024 (121 young adults, grouped by how often they ate take-out food; abstract only) linked more plastic in stool with higher body mass index (odds ratio 1.264, 95% CI 1.108 to 1.441; the unit behind it is not stated). It measured each person once, so it is a snapshot, and take-out food can itself affect weight. Zhen 2026 (1,080 ten-year-olds in the Ma'anshan Birth Cohort; abstract only) found plastic in the urine of 91.1% and sex-specific links with both overweight and underweight; when the urine was collected is not stated in the abstract. Castrogiovanni 2026 (29 children in Cyprus) found no link with body mass index for age, and Schwenger 2024 (23 adults) found no difference in stool plastic between lean and obese groups. None of these can show cause, and Zhao 2024 does not discuss the studies that saw no gain or saw loss.[9, 10, 11, 12]
The fine print: funding, conflicts and corrections
Zhao 2022 was funded by US National Institutes of Health grants and the Jewish Heritage Fund for Excellence; the authors declared no competing interests. Zhao 2024 was funded by National Institutes of Health grants and the University of Louisville School of Medicine; the authors declared no conflicts. We found no correction, erratum, retraction or published dispute for either paper on PubMed, Europe PMC or Crossref as of 22 September 2026. PubPeer was not checked.[1, 2]
The fine print: about this version
This version was shortened and rewritten in plainer words, and the section on whether animal studies matter for humans now comes first. The two at-a-glance boxes became one. How the tests were run, the berry-pigment test and the numbers behind the liver-genes chart moved into this technical record or the questions above, and the studies that found no gain are set out in full under the wider evidence. Every figure that left the story is printed in these sections, from the papers' own text and tables.
Sources
- Zhao J, Gomes D, Jin L, Mathis SP, Li X, Rouchka EC, Bodduluri H, Conklin DJ, O'Toole TE. Polystyrene bead ingestion promotes adiposity and cardiometabolic disease in mice. Ecotoxicol Environ Saf. 2022;232:113239. doi:10.1016/j.ecoenv.2022.113239. PMID 35093814. PMCID PMC8860873. Polystyrene bead ingestion promotes adiposity and cardiometabolic disease in mice
- Zhao J, Adiele N, Gomes D, Malovichko M, Conklin DJ, Ekuban A, Luo J, Gripshover T, Watson WH, Banerjee M, Smith ML, Rouchka EC, Xu R, Zhang X, Gondim DD, Cave MC, O'Toole TE. Obesogenic polystyrene microplastic exposures disrupt the gut-liver-adipose axis. Toxicol Sci. 2024;198(2):210-220. doi:10.1093/toxsci/kfae013. PMID 38291899. PMCID PMC10964747. Obesogenic polystyrene microplastic exposures disrupt the gut-liver-adipose axis
- Huang H, Wei F, Qiu S, Xing B, Hou J. Polystyrene microplastics trigger adiposity in mice by remodeling gut microbiota and boosting fatty acid synthesis. Sci Total Environ. 2023;890:164297. doi:10.1016/j.scitotenv.2023.164297. PMID 37211133. Abstract only. Polystyrene microplastics trigger adiposity in mice by remodeling gut microbiota and boosting fatty acid synthesis
- Zhai Z, Yang Y, Chen S, Wu Z. Long-term exposure to polystyrene microspheres and high-fat diet-induced obesity in mice: evaluating a role for microbiota dysbiosis. Environ Health Perspect. 2024. doi:10.1289/EHP13913. PMID 39226184. PMCID PMC11370995. Long-Term Exposure to Polystyrene Microspheres and High-Fat Diet-Induced Obesity in Mice: Evaluating a Role for Microbiota Dysbiosis
- Lu L, Wan Z, Luo T, Fu Z, Jin Y. Polystyrene microplastics induce gut microbiota dysbiosis and hepatic lipid metabolism disorder in mice. Sci Total Environ. 2018;631-632:449-458. doi:10.1016/j.scitotenv.2018.03.051. PMID 29529433. Abstract only. Polystyrene microplastics induce gut microbiota dysbiosis and hepatic lipid metabolism disorder in mice
- Okamura T, Hamaguchi M, Hasegawa Y, et al. Oral exposure to polystyrene microplastics of mice on a normal or high-fat diet and intestinal and metabolic outcomes. Environ Health Perspect. 2023. doi:10.1289/EHP11072. PMID 36821708. PMCID PMC9945580. Oral Exposure to Polystyrene Microplastics of Mice on a Normal or High-Fat Diet and Intestinal and Metabolic Outcomes
- Hasegawa Y, Okamura T, Ono Y, et al. Oral exposure to high concentrations of polystyrene microplastics alters the intestinal environment and metabolic outcomes in mice. Front Immunol. 2024. doi:10.3389/fimmu.2024.1407936. PMID 39600697. PMCID PMC11588728. Oral exposure to high concentrations of polystyrene microplastics alters the intestinal environment and metabolic outcomes in mice
- Chartres N, Cooper CB, Bland G, et al. Effects of microplastic exposure on human digestive, reproductive, and respiratory health: a rapid systematic review. Environ Sci Technol. 2024. doi:10.1021/acs.est.3c09524. PMID 39692326. PMCID PMC11697325. Used here only for its table row describing Lu 2018. Effects of Microplastic Exposure on Human Digestive, Reproductive, and Respiratory Health: A Rapid Systematic Review
- Hong Y, Feng Y, Yan T, et al. Take-out food enhances the risk of MPs ingestion and obesity, altering the gut microbiome in young adults. J Hazard Mater. 2024. doi:10.1016/j.jhazmat.2024.135125. PMID 39003809. Abstract only. Take-out food enhances the risk of MPs ingestion and obesity, altering the gut microbiome in young adults
- Zhen H, Liu C, Sun D, et al. Sex-specific associations between early-life microplastic exposure and children's physical development: evidence from a study in China. Environ Int. 2026. doi:10.1016/j.envint.2026.110109. PMID 41604981. Abstract only. Sex-specific associations between early-life microplastic exposure and children's physical development: Evidence from a study in China
- Castrogiovanni M, Rapisarda P, Oliveri Conti G, Carroccio SC, Riccobene PM, Ferrante M, Makris KC. Plastic signatures in childhood: first evidence of urinary micro- and nanoplastics in primary school children from Cyprus. Part Fibre Toxicol. 2026. doi:10.1186/s12989-026-00694-5. PMID 42400059. Abstract only. Plastic signatures in childhood: first evidence of urinary micro- and nanoplastics in primary school children from Cyprus
- Schwenger KJP, Ghorbani Y, Bharatselvam S, et al. Links between fecal microplastics and parameters related to metabolic dysfunction-associated steatotic liver disease (MASLD) in humans: an exploratory study. Sci Total Environ. 2024. doi:10.1016/j.scitotenv.2024.176153. PMID 39260480. Abstract only. Links between fecal microplastics and parameters related to metabolic dysfunction-associated steatotic liver disease (MASLD) in humans: An exploratory study
- Jung C, Hugot JP, Barreau F. Peyer's patches: the immune sensors of the intestine. Int J Inflam. 2010;2010:823710. PMCID PMC3004000. Background review, not a source for the studies' findings. Peyer's Patches: The Immune Sensors of the Intestine